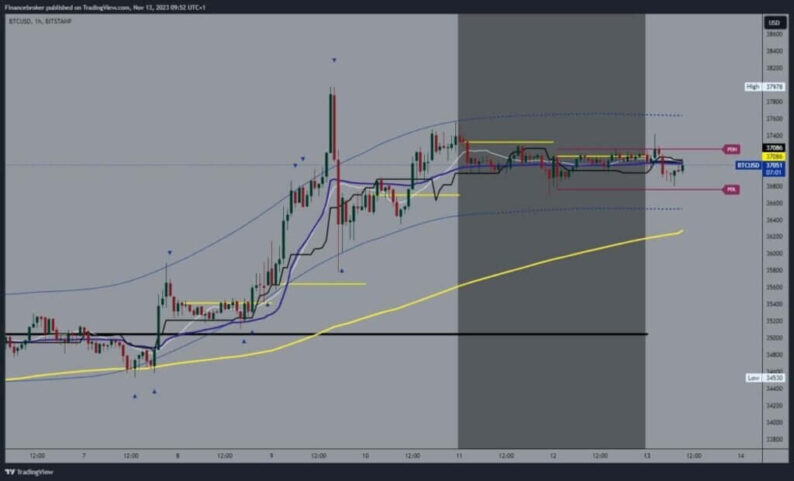
Bitcoin chart analysisOver the weekend, the price of Bitcoin moved in the $36800-$37400 range. Today, we continued in the same scenario, continuing the lateral consolidation. We saw support testing at $36,800 this morning and are now moving above the $37,000 level. We need a continuation of this consolidation in order to climb again and test the $37400 resistance level. A break above would mean that the price has the strength to start a further recovery and extend the previous bullish trend.Potential higher targets are $37600 and $37800 levels. We need a negative consolidation and a drop to the $36800 support level for a bearish option. A break below would lead to the formation of this week’s new low, which we would consider as the beginning of a bearish trend. Potential lower targets are $36600 and $36400 levels. Additional support and an obstacle to further price decline will be found in the EMA50 moving average at the $36400 level.  Ethereum chart analysisOver the weekend, the price of Ethereum was in a slight retreat from last week’s high price at the $2136 level. The price declined only to the 2009$ level and quickly returned to the previous movement zone. Today’s movement is in the same range as for the weekend $2040-$2080. We are currently at $2060 and expect to see progress to the $2080 level. A breakthrough above that level would bring liveliness and increase momentum for further continuation to the bullish side.Potential higher targets are $2100 and $2120 levels. We need a negative consolidation and a pullback to the $2040 support level for a bearish option. A break below would indicate that the price is losing strength, and we will see a further pullback. Potential lower targets are $2020 and $2000 levels. We will have additional price support in the EMA50 moving average in the zone around the $2000 level.
 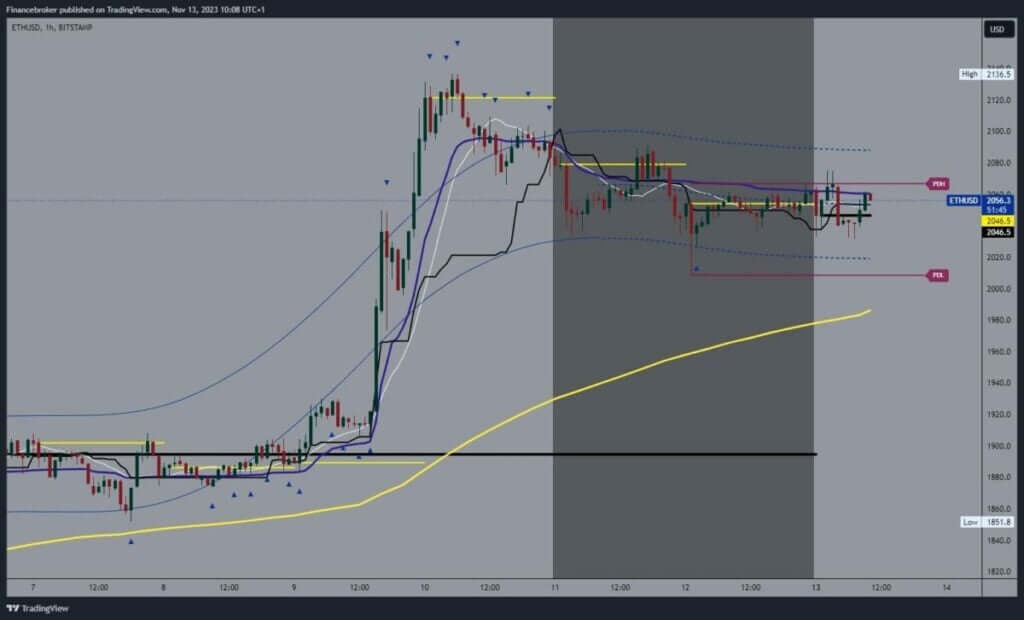 More By This Author:The Dollar Index Remains Below 106.00 On Monday Unlocking Opportunities: When & How to Sell SilverOil And Natural Gas: Oil Is Recovering Above $76.00


Leave A Comment