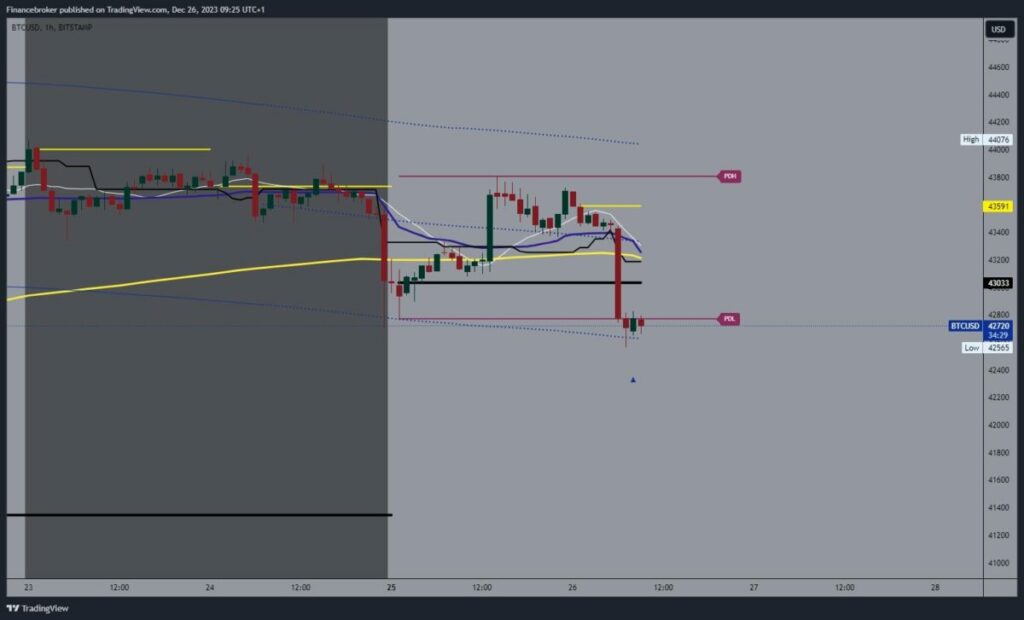
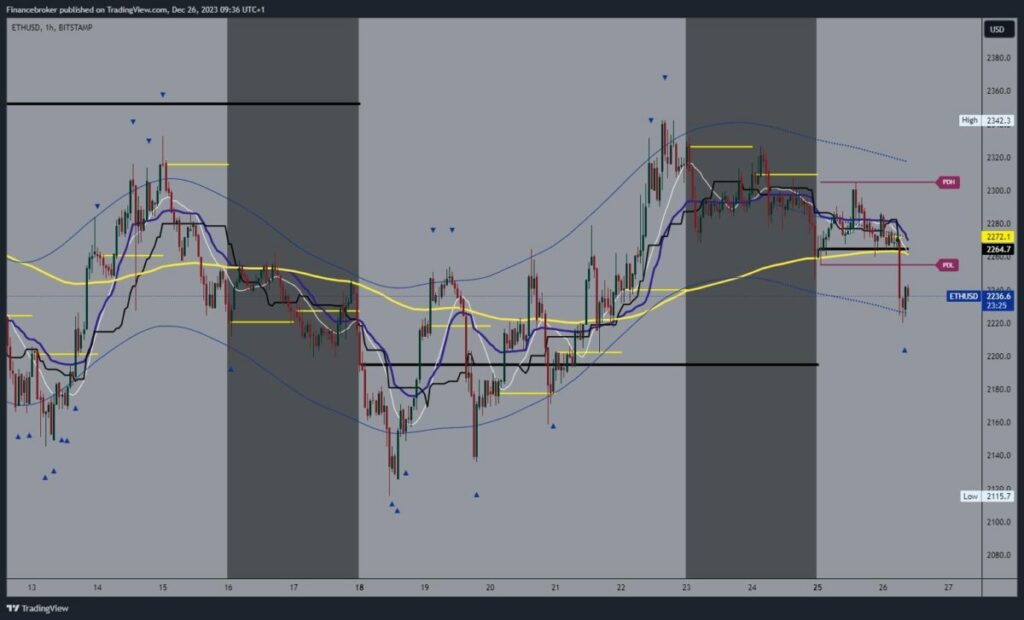
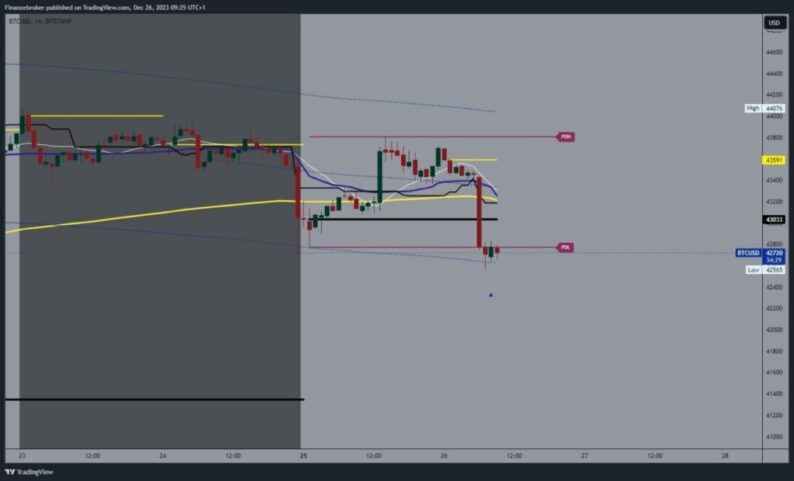
Bitcoin chart analysisToday, we see a pullback in the price of Bitcoin to the $42565 level. The price failed to hold above the $43,500 level, and a drop below followed and a drop to this morning’s low. We remain under pressure in this zone, which could have a negative impact and take us even lower. Potential lower targets are $42400 and $42200 levels.We need to get back above the $42800 level for a bullish option and hold above it. After that, with a new bullish impulse, we would launch a resistance to the bullish side. Potential higher targets are $43000 and $43200 levels. We will have additional resistance in the EMA50 moving average in the zone around the $43200 level.  Ethereum chart analysisEthereum price continued its previous bearish trend. Yesterday we had an attempt to move above $2300, but we only met resistance in that zone and started pulling back again. This caused the price to fall to the $2220 level this morning. The fall was stopped there and the price recovered slightly to the level of $2240. For now, we stop at that level and need a break above for further recovery. Potential higher targets are $2250 and $2260 levels.Additional price resistance could be found in the EMA50 moving average and the zone around the $2260 level. For the bearish option, we need a continuation of the negative consolidation and a drop below this morning’s support at the $2220 level. A break below would mean that we continue to pull back to a new low. Potential lower targets are $2210 and $2200 levels.
  More By This Author:Asian Market Rally: Insights From A Year-End SurgeWill The Rest Of The Stock Market Soar In 2024? Bitcoin And Ethereum: Bitcoin Falls To $42700 This Morning


Leave A Comment