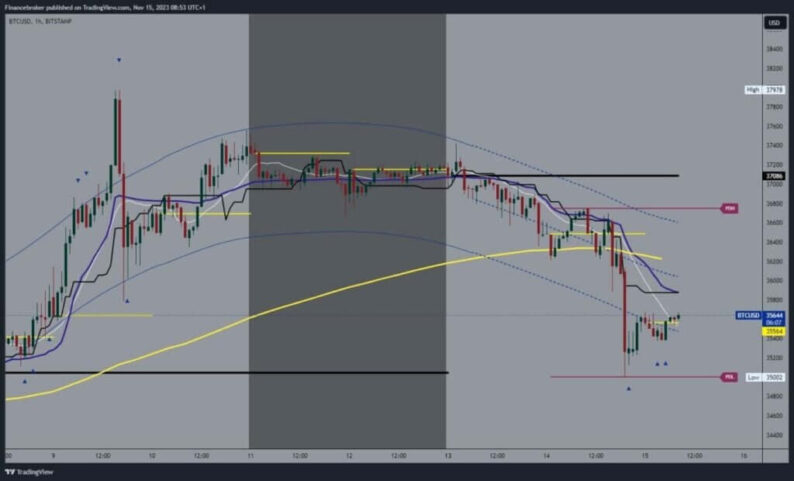
Bitcoin chart analysisThe first two days of this week were very bearish for the price of Bitcoin. Yesterday, we saw the decline and formation of this week’s low at the $35,000 level. The fall is stopped at that level, and the price starts a positive consolidation that takes us up to the $35,700 level. We encounter some resistance in this zone and need a breakout above for further Bitcoin recovery. Potential higher targets are $35800 and $36000 levels.The EMA50 moving average is waiting for us in the zone around the $36,200 level. We need a negative consolidation and a new pullback to the $35000 level for a bearish option. A break below would lead to the formation of a new low, and thus, we would receive confirmation for the bearish option. Potential lower targets are $34800 and $34600 levels. 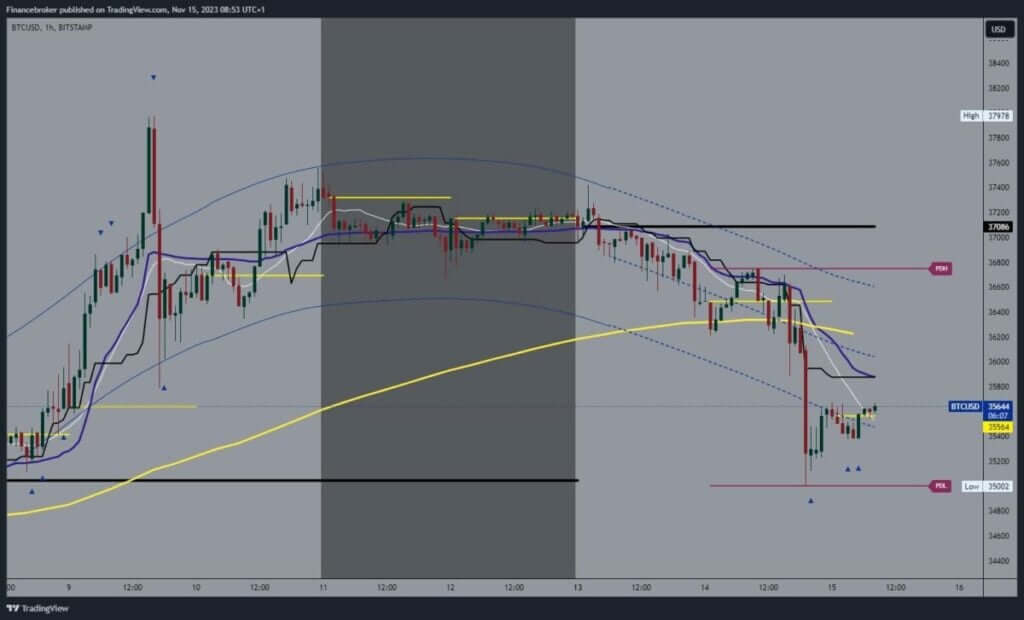 Ethereum chart analysisThe price of Ethereum made a bearish move to the $1940 level yesterday. We failed to hold above the $2040 support level, followed by a breakout below and a drop to the $1940 level. The price broke through $2000, and there was no attempt to maintain it at that level. After support at the previous low, the price starts a bullish consolidation and climbs to $1987. If today’s consolidation continues, we could return above the $2000 level.Potential higher targets are $2020 and $2040 levels. We will have additional resistance in the zone around $2000, in the EMA50 moving average. We need a negative consolidation and pullback below the $1960 level for a bearish option. A break below would bring us down to test yesterday’s low, and we may see a further drop below and the formation of a new low. Potential lower targets are $1920 and $1900 levels.
 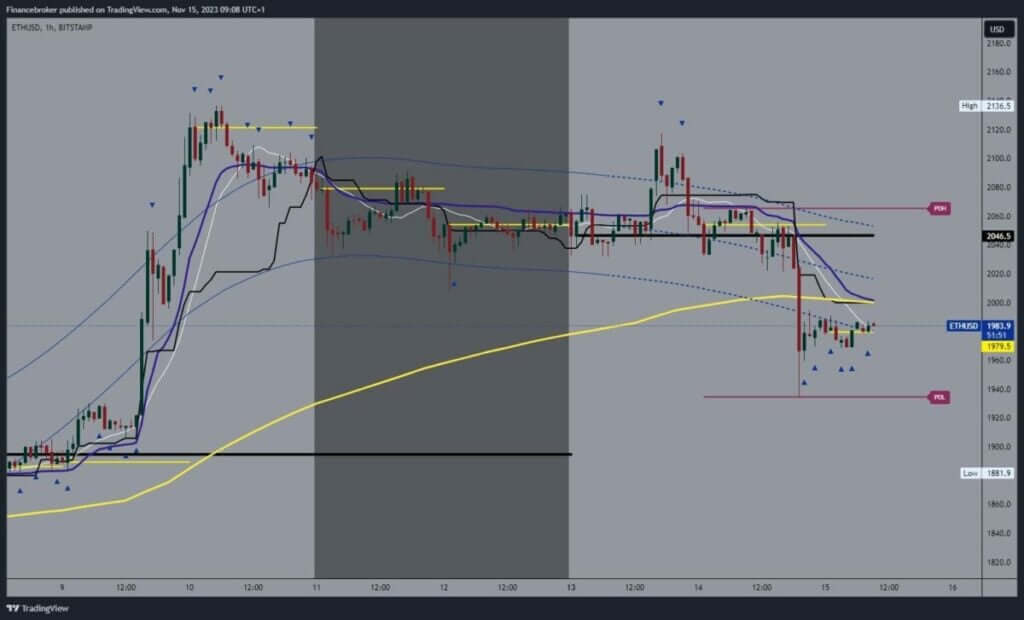 More By This Author:Dogecoin And Shiba Inu: Dogecoin Slipped To 0.07250 Level Bitcoin And Ethereum: Bitcoin Fell To $36200 This Morning USDCHF And USDJPY: USDJPY Could Climb To 152.00 Level


Leave A Comment