
Bitcoin chart analysisIn the last 24 hours, Bitcoin price has moved below the EMA50 moving average. This week’s pressure on the price dropped yesterday to $36,727. There, we get support, start a bullish consolidation, and climb up to $27300, where we meet resistance and bounce off the EMA50 moving average. After that, we make a bearish consolidation to new support at the $36900 level. There, we form higher low prices and climb up to the $37,000 level.We need a break above if we want it to break out of this bearish pressure. A move to the $37400 level would give us room to consolidate above the EMA50 and start a continuation on the bullish side. Potential higher targets are $37600 and $37800 levels. We need a negative consolidation and pullback below the $36800 support level for a bearish option. Potential lower targets are $36600 and $36400 levels. 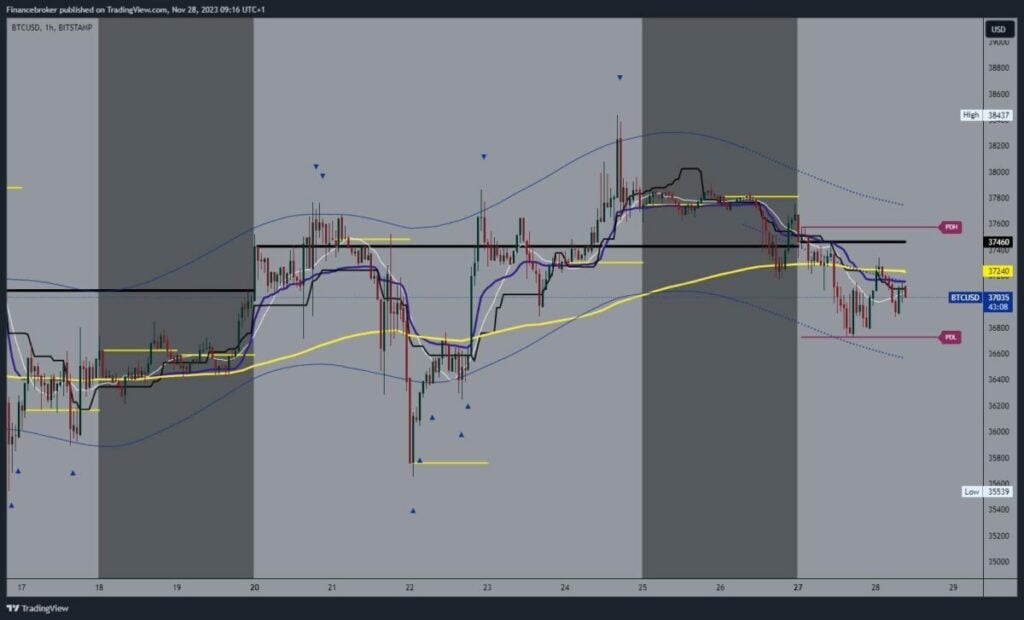
Ethereum chart analysis
Yesterday, we saw the Ethereum price pull back below the EMA50 moving average and the $2000 level. This week’s low was formed at the $1986 level, where we managed to get support. After that, we see an attempt by the price to recover, but we stop at the $2040 level. There, we retest the EMA50 and fail to climb above it, and the price pulls back to the $2000 level again.Somehow, we are holding above, but we are still under pressure to see a new breakout below and the formation of a new low. Potential lower targets are $1980 and $1970 levels. We need a positive consolidation and a new jump to the $2040 level for a bullish option. Then, we need a break above that level and the EMA50 moving average. If we could manage to move above, we would be in a good position to continue on the bullish side.  More By This Author:The Ripple Effect Of Oil Drops On Gulf Markets The Dollar Index Remains Low Around The 103.20 Level Bitcoin Is On The Defensive, Ethereum Is Under More Pressure


Leave A Comment