 Image Source: Pixabay
Silver (XAG/USD) enters a bullish consolidation phase and oscillates in a narrow trading band just above mid-$24.00s through the first half of the European session on Tuesday. The white metal, however, remains well within the striking distance of a near three-month high touched on Monday and seems poised to prolong its recent strong appreciating move witnessed over the past two weeks or so.From a technical perspective, the recent breakout through the 200-day Simple Moving Average (SMA) and a subsequent strength beyond the $24.00 round figure was seen as a fresh trigger for bullish traders. Furthermore, oscillators on the daily chart are holding comfortably in the positive territory and are still far from being in the overbought zone, validating the near-term positive outlook for the XAG/USD.Hence, any meaningful downside might still be seen as a buying opportunity near the aforementioned resistance breakpoint now turned support near the $24.00 mark. This should help limit the downside for the XAG/USD near the 200-day SMA, currently pegged near the $23.35-$23.30 region. That said, a convincing break below might prompt some technical selling and pave the way for some meaningful downside.The XAG/USD, meanwhile, still seems poised to make a fresh attempt to conquer the $25.00 psychological mark. The next relevant hurdle is pegged near the $25.25 region, or the YTD peak touched in May, which if cleared decisively will reaffirm the bullish bias. The white metal might then accelerate the positive momentum towards reclaiming the $26.00 round figure for the first time since April 2022.
Silver daily chart 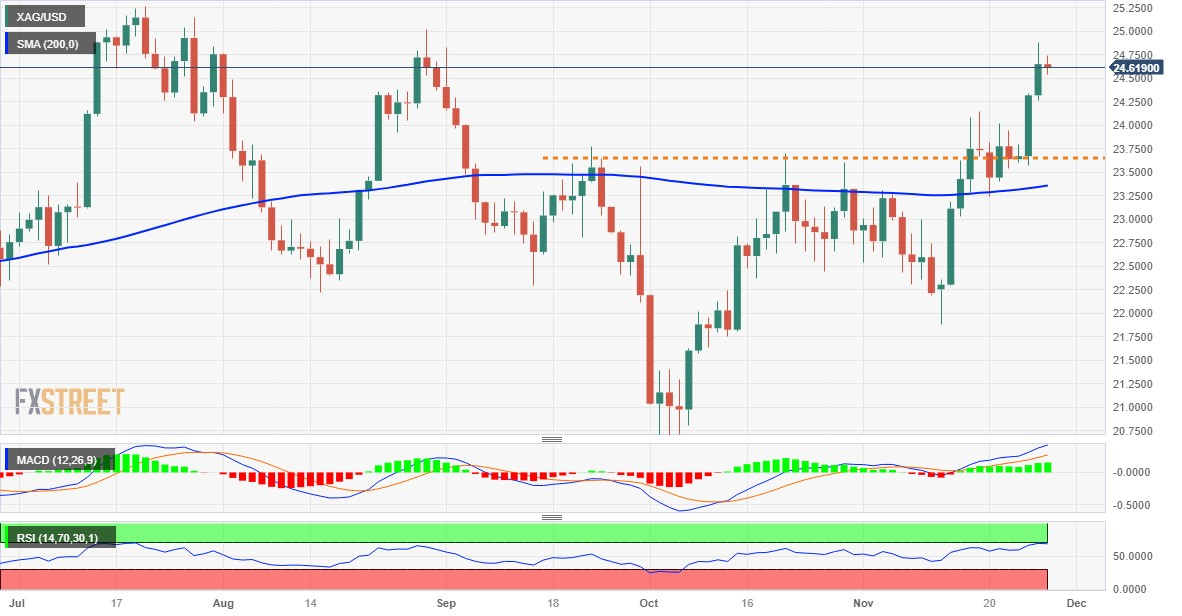
Technical levels to watch
XAG/USD
More By This Author:USD/CHF Attempts To Rebound From Three-Month Lows, Trades Above 0.8800
EUR/USD Refreshes Multi-Month Peak As Fed Rate Cut Bets Continue To Undermine The USD
XAU/USD Climbs To A Six-Month Highs Near $2,015 On The USD Weakness, Eyes On The US Data


Leave A Comment