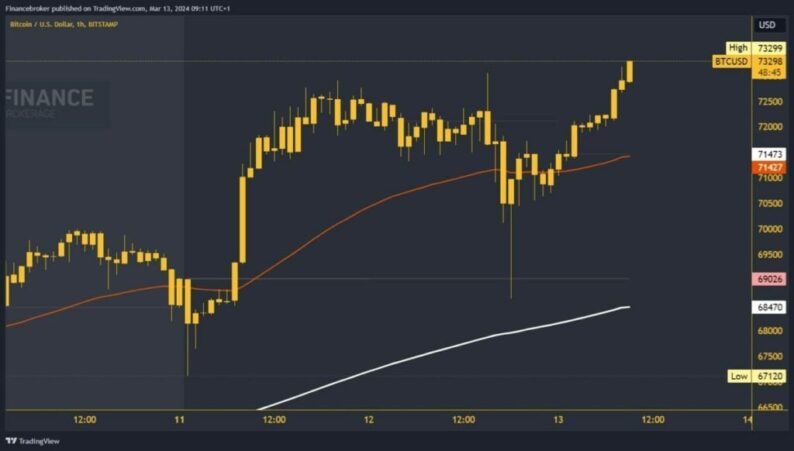
Bitcoin chart analysisToday, we are looking at the price of Bitcoin at a new all-time high at the $73291 level. Yesterday, we saw the first break above the $73000 level. After which the price began to behave unstable and we saw a sudden drop to the $68636 level. We were briefly down and quickly returned above the $70,000 level. This was followed by the initiation of bullish consolidation and growth to a new high.We are currently at $72388 and holding high. This could produce a new bullish impulse and jump to a new high. Potential higher targets are the $73500 and $73750 levels. We need a negative consolidation and a pullback to the $72000 level for a bearish option. We had some slow motion and held in that zone this morning.  Can Bitcoin reach $75000 in the coming days?Bitcoin sliding below would reinforce the bearish momentum and push it lower. After that, we look at the zone around the $71500 level and test the daily open price there. By falling below, we form a new daily low and thereby confirm that bearish momentum prevails. Potential lower targets are $71000 and $70500 levels.For now, we are not thinking about the bearish side and expect the price of Bitcoin to hit a new all-time high soon. Bitcoin coin trading volume in the last 24 hours increased by 5.58% to 62 billion dollars, while the market cap of Bitcoin increased by 1.80%.More By This Author:Navigating The New Realities Of U.S. Tech In China Dogecoin And Shiba Inu: Dogecoin Slips Below 0.18000 LevelCardano Soars Past $0.780, Eyes $0.8320


Leave A Comment