
Bitcoin is about to rise 20%, sooner rather than later. Why? Because of its chart setup: a breakout one month ago combined with a gap between 10,000 and 12,000. Once again, the chart says it all.
By the way, this short term Bitcoin price forecast is unrelated to our long term target. Everything is still lined up to meet, at a certain point in the future (next 12 to 36 months), our long term Bitcoin price forecasts:
Why The Price Of Bitcoin Could Go To 50,000 USD In 2019 (by 2019)
A Bitcoin Price Forecast Of 160,000 USD (by 2020 to 2022)
For Bitcoin’s short term forecast we see a gap on its chart as indicated on below chart (orange annotations). The price of Bitcoin broke out from its downtrend a month ago, right after we sent an alert to our premium blockchain & cryptocurrency subscribers. A quick ride from 8,000 to almost 10,000 followed.
Once Bitcoin crosses 10,000 it will fill the gap on its chart, very easily and fast. The 20% rally from 10,000 to 12,000 is underway, and we believe nothing stands in the way of Bitcoin to start this rally anytime soon.
Note on the chart that Bitcoin is now undergoing a second attempt to go through 10,000. In chart-terms, we call it ‘testing its resistance level’. A third attempt may be needed, we cannot know in advance, but whether it requires 2, 3 or even 5 attempts is not important. With some patience we will see the rally primarily because of this Beautiful Cryptocurrency Chart Confirming The Strong Bull Market In 2018 And 2019.
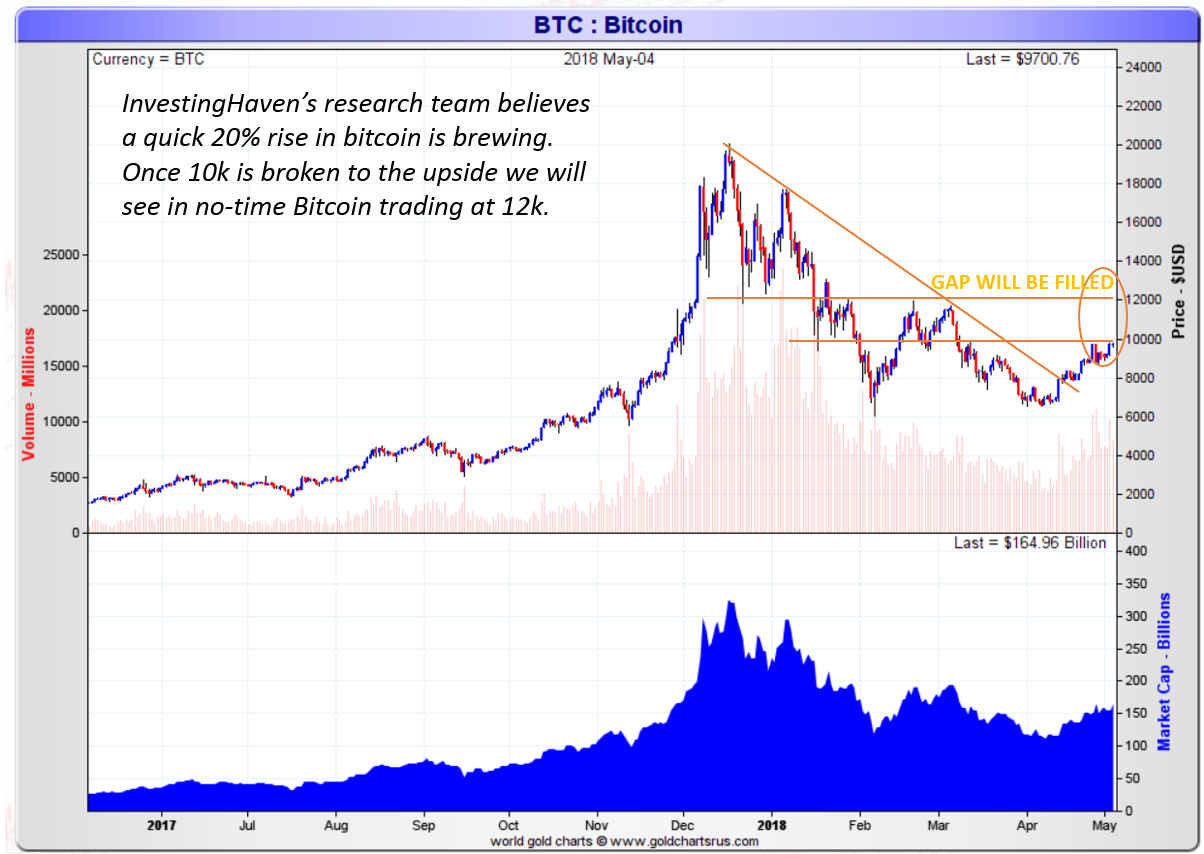
Chart courtesy: Goldchartsrus.


Leave A Comment