
On Friday, breadth calculated between the most bullish and most bearish stocks on Twitter crossed back above the zero line. The recent rally brought with it strong bullish readings in enough stocks to overwhelm the bearish stocks. This is a constructive sign… maybe. I’m hedging because I suspect the indicator has a bullish bias.
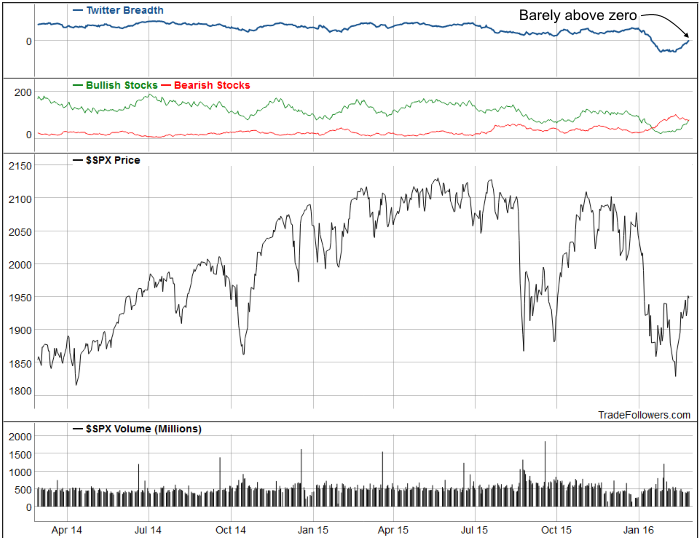
The breadth indicator is built on top of our bullish and bearish algorithm that reads the Twitter stream for about 650 stocks. It is in part a sentiment indicator because many market participants tweet opinion about the future direction of stocks. The algorithm also captures action (buying, selling, hedging), fundamental analysis, and technical analysis… which is often influenced by “opinion”. Unfortunately, we humans tend to let emotion cloud the facts. Fortunately for our everyday lives, we’re an optimistic species. Unfortunately, that is where the problem for the breadth indicator lies. We are more likely to buy stocks than sell them short. We are more likely to tweet about stocks that we own that are going up, than stocks that we own that are going down. We are more likely to tweet technical analysis indicators that align with our opinion… which for most of us is optimistic. For those reasons (and many more) I suspect that the breadth indicator has an inherent bullish bias. As a result, I’m guessing the bear trigger and the bull trigger might lie at different levels (more on that below).
The breadth indicator has proven its worth over its three years of history by not turning negative until 1/19/16. The signal coincided with several other intermediate and long term indicators that I follow — it’s always good to see a new indicator be confirmed by older, more proven indicators. Here are some examples of their bearish signals.
On 8/31/15, monthly MACD for the S&P 500 Index (SPX) clearly broke its uptrend. Monthly Momentum looks like it will close this month with a clear bearish signal.


Leave A Comment