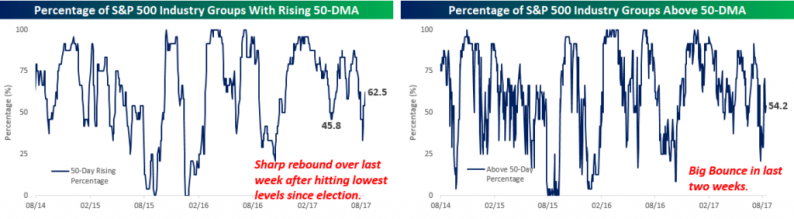
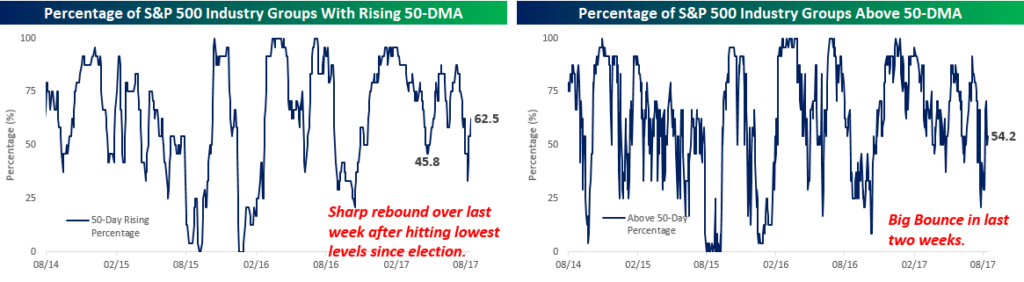
The recent sideways churning of the market that we highlighted in an earlier post has also made its presence felt in the short term breadth of S&P 500 Industry Groups. To highlight this, the top two charts below show the percentage of S&P 500 Industry Groups with rising 50-day moving averages (DMA) and the percentage trading above their 50-DMAs. While the picture is a bit wobbly in the short term with respect to Industry Groups and their 50-DMAs, things have improved somewhat in the last week or two. Less than two weeks ago, fewer than 40% of Industry Groups were above their 50-DMAs or even had rising 50-DMAs. Today, both of these readings are above 50%. Not great, but not necessarily bad either.
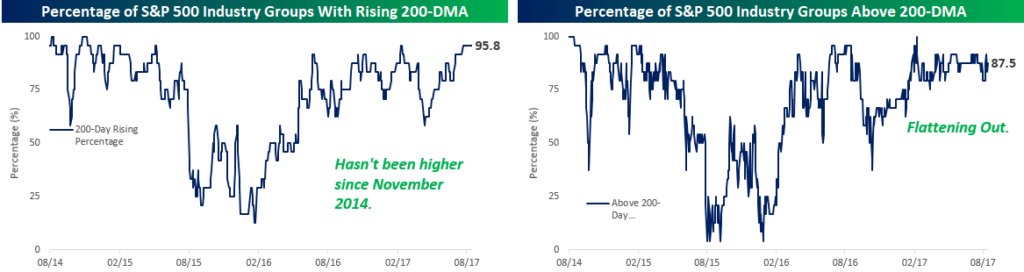
While shorter term breadth readings have been weaker in the last several weeks than they were earlier this year, long-term readings look considerably more positive. The two charts below are the same as the two above except that instead of using the 50-DMA, they are based on the 200-DMA. Here, we haven’t seen any of the weakness that we have seen with groups relative to their 50-DMAs, and they reinforce the fact that while the short-term technicals have been showing weakness, the long-term backdrop for the market remains solid. As shown, 95.8% of Industry Groups have rising 200-DMAs, and the only one below that level is Energy. Similarly, 87.5% of Industry Groups are currently above their 200-DMAs with the only three trading below being Banks, Energy, and Telecom Services. If the current churning that we have seen in the charts above continues, it will start to show up in the charts below, but for now, the weak breadth remains a short-term as opposed to a long-term issue.


Leave A Comment