SHORT-TERM/DAILY:
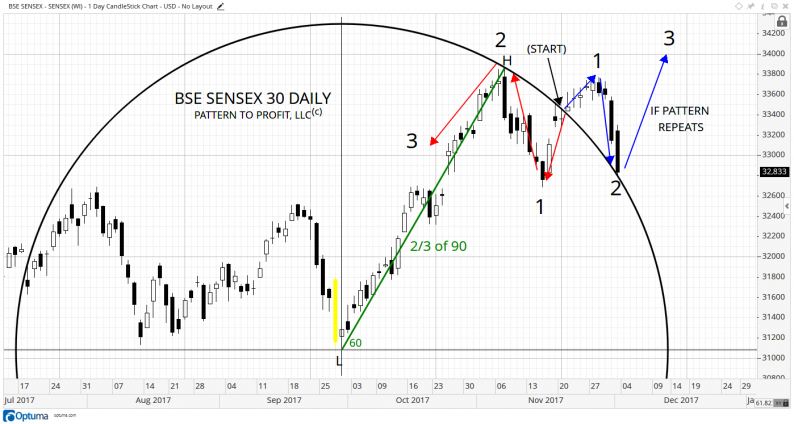
Last Friday, December 1st saw the Sensex dropping and touching circular support as seen in this next chart. It missed the specific price support level of the circle by only 2.50 points:

The circular resistance (now support) shown is a geometric expression of the preceding uptrend (marked L-H) and set to 60o (green) or 2/3 of 90o. Its resulting circle provides regression for the market, as outlined by the sets of blue and red arrows.
If the backwards pattern (red) repeats forward (blue) with the third move (up), a significant uptrend may ensue, with higher highs. If the pattern does not repeat, the market may drop back inside the circle, proving the circular support ineffective and a short-term change in trend would then be in effect, signaled by a lower low (from Friday).
However, in assessing the potential of a reversal off of circular support for this Monday, December 4th the next chart identifies the current market as related to the preceding two lows:
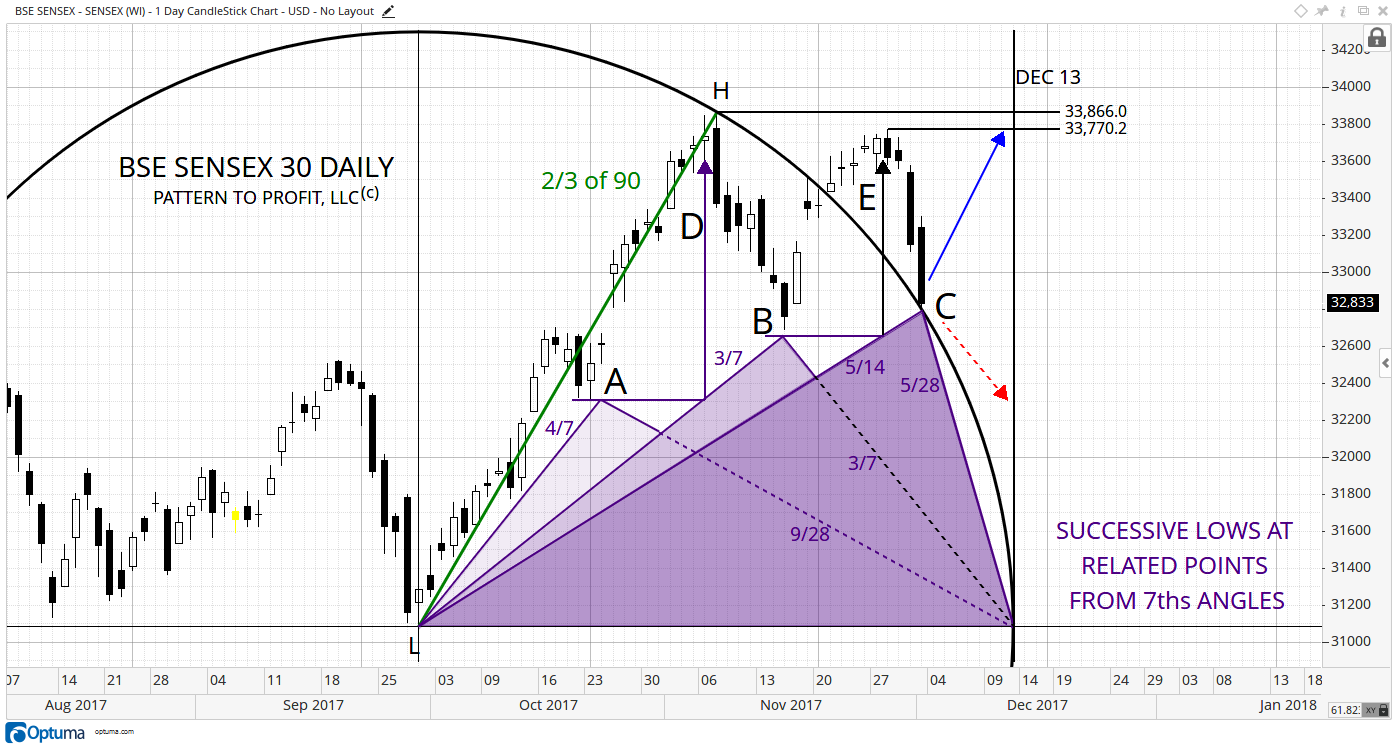
By combining 7ths angles from both the center (L) and the right ‘corner’ of the circle, triangles are formed whose apexes pinpoint the lows at A and B, and a potential low currently at C.
(The top areas at D and E are related as well, as the price levels of A and B square (or make a 90o angle from) the adjacent triangles giving effective timing points (vertical purple). This activity lends strength to the analysis.
If the market does reverse this Monday off circular support, reaching previous high prices of 33,770.2 and possibly 33,866 is anticipated. The timing point of December 13, 2017 (circle’s right edge) is given as a distinct possibility for arrival to either of those levels.


Leave A Comment