BTC/USD exhibits bearish short-term trends; potential pivotal zones could dictate trading strategies. Focus on key support/resistance levels for entry points.My previous BTC/USD signal on 19th March was not triggered as none of the key support or resistance levels were hit that day. Today’s BTC/USD Signals
 Long Trade Ideas
Short Trade Idea
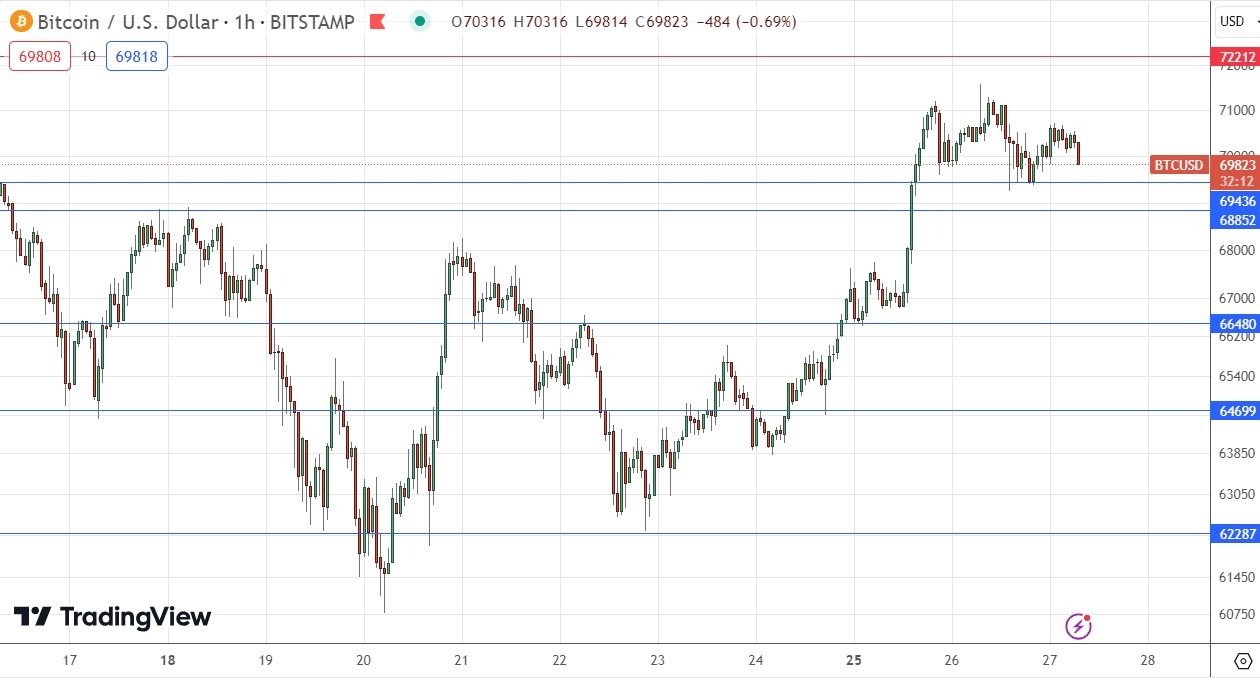
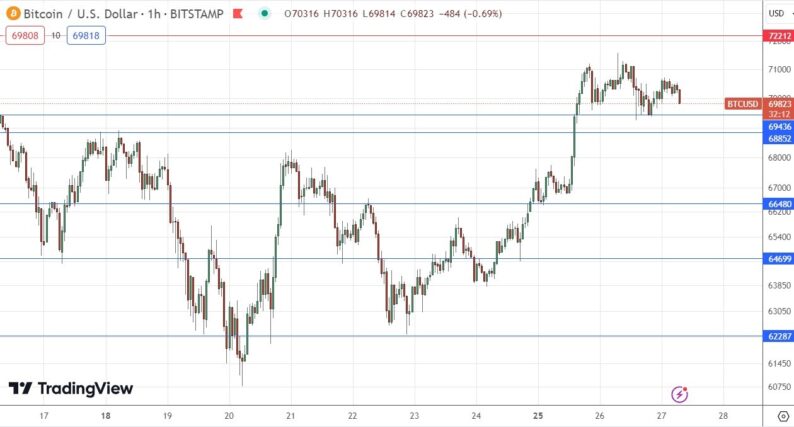
The best method to identify a classic “price action reversal” is for an hourly candle to close, such as a pin bar, a doji, an outside or even just an engulfing candle with a higher close. You can exploit these levels or zones by watching the price action that occurs at the given levels. BTC/USD AnalysisI wrote in my previous BTC/USD analysis on Tuesday last week that the technical picture was now considerably more bearish as the price fell with no obvious support levels until about $60,000 was reached. This was a great call as it gave an immediate short trade entry that went below $61,000 that day, although it never quite reached $60,000.The price of Bitcoin has basically recovered since then, but now looks like it has topped out at about $71,000 some way below the recent all-time high near $74,000. The price is currently heading lower, and it looks as if the potentially supportive zone between $69,436 and $68,852. I think its likely this zone will be reached, and the zone should be pivotal today. That means two consecutive hourly closes below that zone could be a good short trade entry signal targeting the next support level at $66,480. On the other hand, if the zone produces a bullish bounce, especially if $68,852 is rejected, that could be an attractive long trade entry. Personally, I want to see Bitcoin make a new high about $74,000 before taking any long trades, especially in this area after the price has been rising for a few days. More By This Author:Forex Today: Fed Says 3 Rate Cuts in 2024, Stocks, Gold BoomForex Today: Markets Await FOMC MeetingForex Today: Markets Expecting First BoJ Rate Hike In 17 Years


Leave A Comment