The BTC/USD pair has been in a narrow range in the past few days. Bullish view
Bearish view
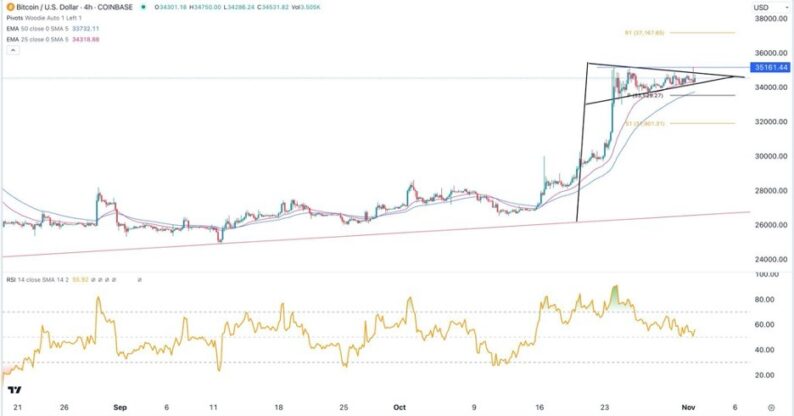
Bitcoin and American stocks and bonds reacted positively to the latest Federal Reserve interest rate decision. The BTC/USD pair remained above 34,600 on Thursday morning and is nearing the year-to-date high of 35,161. It has jumped by over 38% from the lowest level in September. Federal Reserve decisionThe Federal Reserve, as widely expected, decided to leave interest rates unchanged between 5.25% and 5.50%. In its statement, the bank said that the American economy was holding strong despite the elevated interest rates.The Fed also left the door open for another rate increase if inflation remains above the 2% target. In his press conference, Jerome Powell said that that the bank will remain data-dependent when determining the next rate decision.The key data to watch ahead of the last meeting of the year will be two non-farm payrolls (NFP) and two consumer inflation data. The first of these reports will come out on Friday when the Fed will release the latest jobs numbers.In addition to Bitcoin, stocks and bonds reacted positively to the Federal Reserve decision. The Dow Jones jumped by over 245 points while the S&P 500 and Nasdaq 100 indices rose by 50 and 207, respectively. The 10-year Treasury yield dropped by 2.44% to 4.76% while the 30-year moved below 5% for the first time this week. Bond yields move inversely to prices. At the same time, the yield curve narrowed to minus 15.8 while the US dollar index (DXY) dropped to $106.54.There will be no macro event on Thursday. Therefore, traders will focus on the upcoming NFP data. On Wednesday, data by ADP revealed that the country’s private sector created 113k jobs in October. BTC/USD technical analysisThe BTC/USD pair has been in a narrow range in the past few days. On the 4H chart, the pair has moved above the 25-period and 50-period Exponential Moving Averages. It has also formed a bullish pennant pattern. This pattern is often a sign that the pre-existing trend will continue.The pair has also moved above the Woodie pivot point. However, the Relative Strength Index (RSI) has also formed a bearish divergence pattern. In all, the outlook for the pair is bullish, with the next resistance point to watch being the psychological point at 36,000. 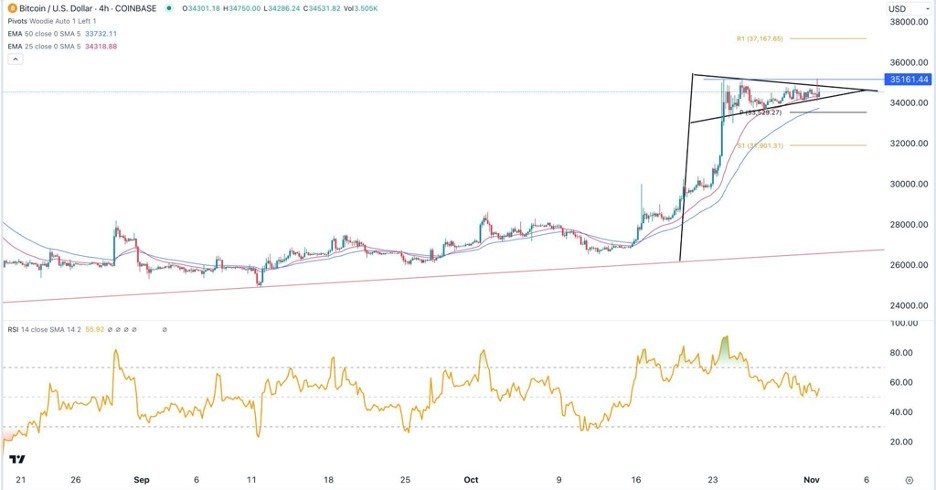 More By This Author:GBP/USD Forecast: Sees PressureAUD/USD Forecast: Sees Noisy BehaviorSilver Forecast: Market Continues To See Noise


Leave A Comment