BTC/USD swings wildly; buy target at 70,000, sell at 64,525. Bitcoin reacts to US inflation data and market sentiment, with technical analysis hinting at future trends. Bullish view
Bearish view
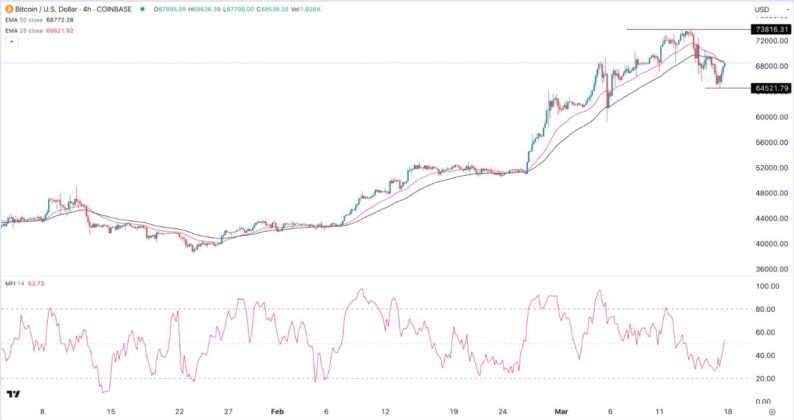
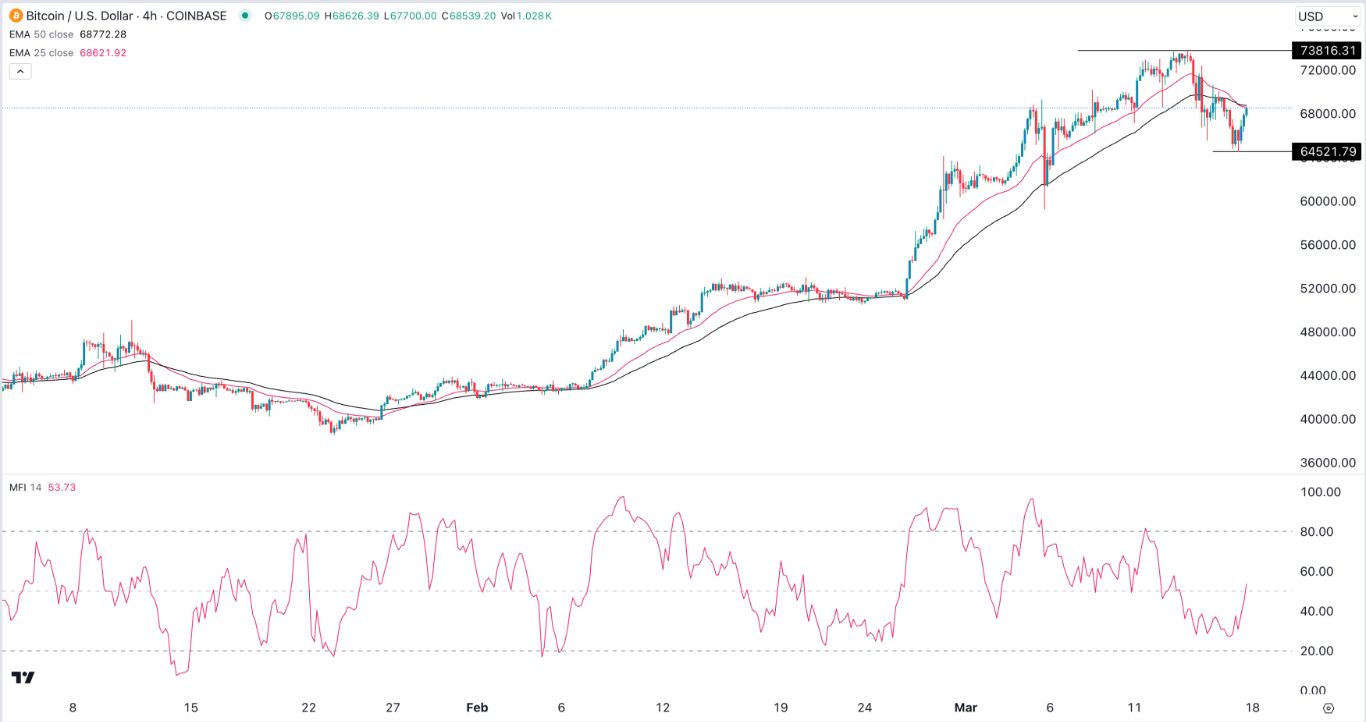 Bitcoin prices had some wild swings during the weekend as some bulls started to take profits. After soaring to a record high of 73,816 last week, the BTC/USD pair tumbled to a low of 64,520 on Sunday and bounced back to over 68,000. Profit-taking as risk-off sentiment continuesBitcoin retreated sharply after the US published strong inflation numbers. The core consumer price index (CPI) rose to 3.8% in February while the core PPI jumped to 2.0%, higher than the expected 1.9%.These numbers triggered a risk-off sentiment in the market. The US dollar index jumped to $103 while bond yields continued soaring. The 10-year and 30-year bond yield jumped to 4.30% and 4.43%, respectively.This trend continued in the stock market where the Nasdaq 100 and S&P 500 indices retreated by over 0.50% on Friday. In most cases, Bitcoin tends to drop sharply in these market conditions.Still, there are some positive indications in the Bitcoin market. The most recent data shows that the iShares Bitcoin Trust (IBIT) had over $15.9 billion in assets while the Fidelity Wise Origin Bitcoin ETF had over $6.6 billion.Other smaller ETFs have also seen strong inflows recently. For example, the Valkyrie Bitcoin Fund (BRR) has over $440 million in assets while the Ark 21Shares Bitcoin ETF has more than $1.5 billion in assets. This trend may continue in the coming months.The ongoing Bitcoin demand is happening at a time when supply is not doing well. Supply in exchanges has continued falling while the upcoming halving event will slow the amount of Bitcoins that are supplied in exchanges.Therefore, the ongoing supply and demand dynamics will likely lead to higher prices in the long term. BTC/USD technical analysisThe BTC/USD pair tumbled to a low of 64,520 on Sunday as a sea of red continued in the crypto industry. It then bounced back to over 68,000 as some investors bought the dip. Bitcoin has remained below the 50-period and 25-period Exponential Moving Averages (EMA). The two have even formed a bearish crossover pattern.The Money Flow Index (MFI) has also pointed upwards and moved slightly above the neutral point at 50. Therefore, the BTC/USD pair will likely continue rising as bulls attempt to push it above the resistance at 70,000. A drop below Sunday’s low of 64,520 will likely open the possibility of it moving to 60,000.More By This Author:Zillow Stock Price Forecast: The Plot Thickens BTC/USD Forex Signal: No End in Sight For The Bitcoin Price Bull RunAUD/USD Forex Signal: Inverse Head And Shoulders Pattern Forms


Leave A Comment