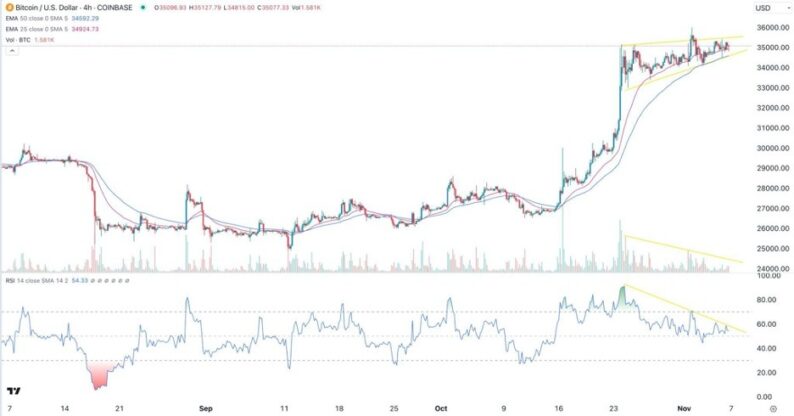
Bitcoin’s volume has continued falling while the Relative Strength Index (RSI) has formed a bearish divergence pattern. Bullish view
Bearish view
The BTC/USD pair continued consolidating this week as the recent bullish momentum faded. Bitcoin has been stuck at the resistance point at 35,000 since October 25th. It still remains much higher than last month’s low of $24,800. Waiting for the next catalystBitcoin and other cryptocurrencies remained in a tight range on Monday and Tuesday morning. The consolidation was in line with the performance of American equities as the Dow Jones shed 65 points. Similarly, the Nasdaq 100 index and the S&P 500 fell by 25 and 7 points, respectively.It also coincided with the small rebound of American bond yields. The 10-year bond yields rose slightly to 4.65% while the 30-year jumped to 4.82%. The price of crude oil rose by more than 1% after OPEC+ and Russia signaled that they will continue with supply cuts.Bitcoin also reacted mildly to last week’s Federal Reserve decision. In it, the bank left interest rates unchanged between 5.25% and 5.50%. It also hinted that it will maintain rates in this range for a few months.Meanwhile, there are signs that investors are buying Bitcoin. On-chain data shows that the number of blockchain addresses holding at least $1,000 jumped to a record high of 8 million.Analysts believe that the trend will continue rising, helped by numerous catalysts. There is a likelihood that the Fed will cut interest rates in the second half of 2024. In most periods, bitcoin and other risky assets tends to do well in periods of low interest rates.The other catalyst is the likelihood that the Securities and Exchange Commission (SEC) will approve the ETF in the coming months. If this happens, there will be higher demand for the coin. Also, Bitcoin will go through a halving event that will reduce Bitcoin supply. BTC/USD technical analysisThe 4H chart shows that the BTC/USD pair has moved sideways in the past few days. It has remained slightly above the 50-day moving average. Most importantly, it has formed what looks like a bullish pennant pattern, which is one of the most popular bullish signs.Bitcoin’s volume has continued falling while the Relative Strength Index (RSI) has formed a bearish divergence pattern. Therefore, the pair will likely remain in this consolidation phase in the coming days. It will then have a bullish breakout as buyers target the resistance at 36,000. 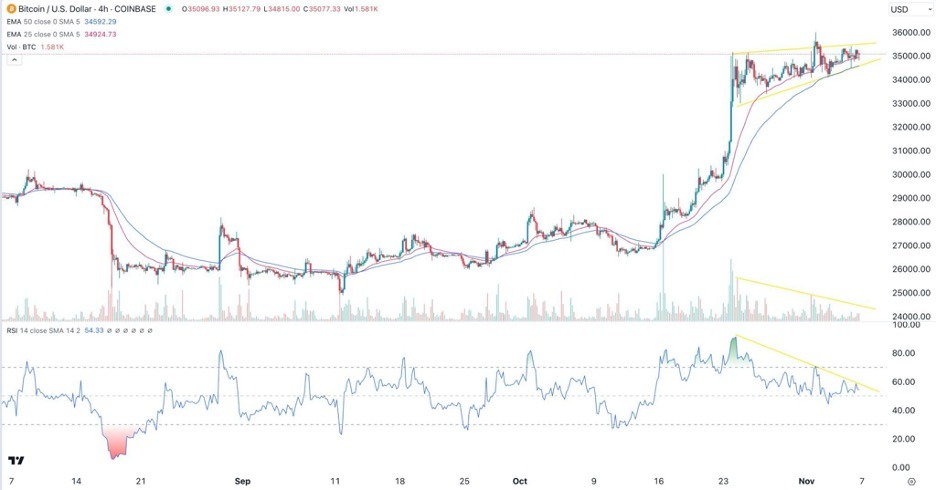 More By This Author:Gold Technical Analysis: The Dollar’s Decline Supports GoldBTC/USD Forex Signal: Narrowing Triangle Pattern Centered On $35,000AUD/USD Forex Signal: Inverted H&S Pattern Forms On The Weekly Chart


Leave A Comment