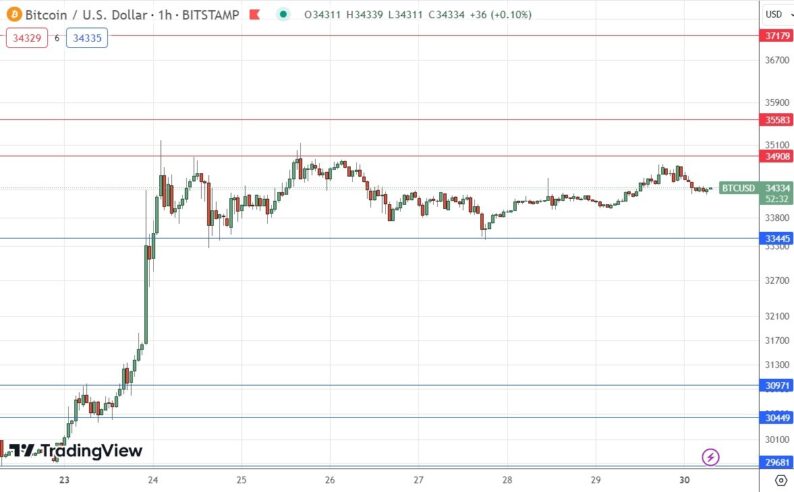
Essentially, Bitcoin is stuck in a consolidation pattern between $33,445 and $35,000. My previous BTC/USD signal on 26th October was not triggered as there was no bullish price action when the resistance level at $34,281 was first reached that day. Today’s BTC/USD SignalsRisk 0.75% per trade.Trades may only be taken before 5pm Tokyo time Tuesday. Long Trade Ideas
Short Trade Ideas
The best method to identify a classic “price action reversal” is for an hourly candle to close, such as a pin bar, a doji, an outside or even just an engulfing candle with a higher close. You can exploit these levels or zones by watching the price action that occurs at the given levels. BTC/USD AnalysisI wrote in my previous BTC/USD analysis that bulls had been failing to break above the $35,000 resistance level, which looked pivotal, so I thought that the next thing to watch was whether the support levels at $34,281 or $33,445 continued to hold. I paid particular attention to the lower level.This was a good call as the support level at $33,445 has continued to hold, so although the price has remained below $35,000 over the past days, it is still holding up, and has not made a significant bearish breakdown.Essentially, Bitcoin is stuck in a consolidation pattern between $33,445 and $35,000. One obvious way to play this will be to wait for a daily close above $35,000 for a long trade entry signal, or for a daily close below $33,445 for a short trade entry signal. A more aggressive approach would be to wait for two consecutive higher hourly closes above $35,000, or lower below $33,445.The fundamental driver of Bitcoin’s recent strength is the increased speculation that a retail Bitcoin ETF by Blackrock is close to securing regulatory approval. However, there is plenty of evidence that if this happens, it will not happen for several months yet at least, so this bullish push may be premature and could quickly fade away. Another factor is the absence of strong risk-on sentiment, which tends to depress the price of Bitcoin.Therefore, I think the resistance at $35,000 is more likely to hold than to break.  More By This Author:GBP/USD: Weekly Forecast For Oct. 29 – Nov. 4Trading Support And Resistance – Sunday, Oct. 29GBP/USD Technical Analysis: Strong Selling Saturation Levels


Leave A Comment