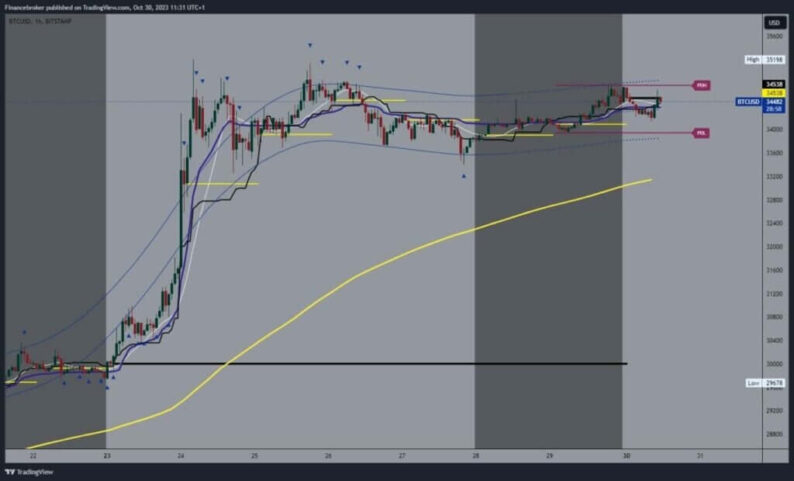
Bitcoin chart analysisOver the weekend, the price of Bitcoin remained well above the $34,000 level. At the beginning of this week, the price begins to pull back from the $34,750 level to support at the $34,150 level. We are getting new support in that zone, and with a bullish impulse, we are starting to jump above the $34500 level.We need a continuation and a break above the $34750 level. Then, we would have to hold on above and form the bottom from which we would start the continuation of positive consolidation.Potential higher targets are $35000 and $35250 levels. For a bearish option, we need a negative consolidation and a drop below the $34000 level. This would affect the price to be under more pressure to start a bigger pullback. Potential lower targets are $33800 and $33600 level  Ethereum chart analysisThe weekend for Ethereum was in a mild bullish consolidation. At the beginning of this week, we saw the Ethereum price drop to the $1780 support level. After that, a bullish impulse and a jump to the $1820 level would occur.At that level, we form this week’s high for now, and we expect to see a continuation to the bullish side. The price is currently stuck at that level, which could produce a certain consolidation and slowing down of the bullish trend.Potential higher targets are the $1830 and $1840 levels. For a bearish option, we need a negative consolidation and a new pullback to support at the $1780 level. A drop below would mean that bearish pressure has increased, and we will see a possible bigger pullback looking for support at lower levels.Potential lower targets are $1760 and $1740 levels. Additional support is the EMA50 moving average in the zone around the $1760 level.
 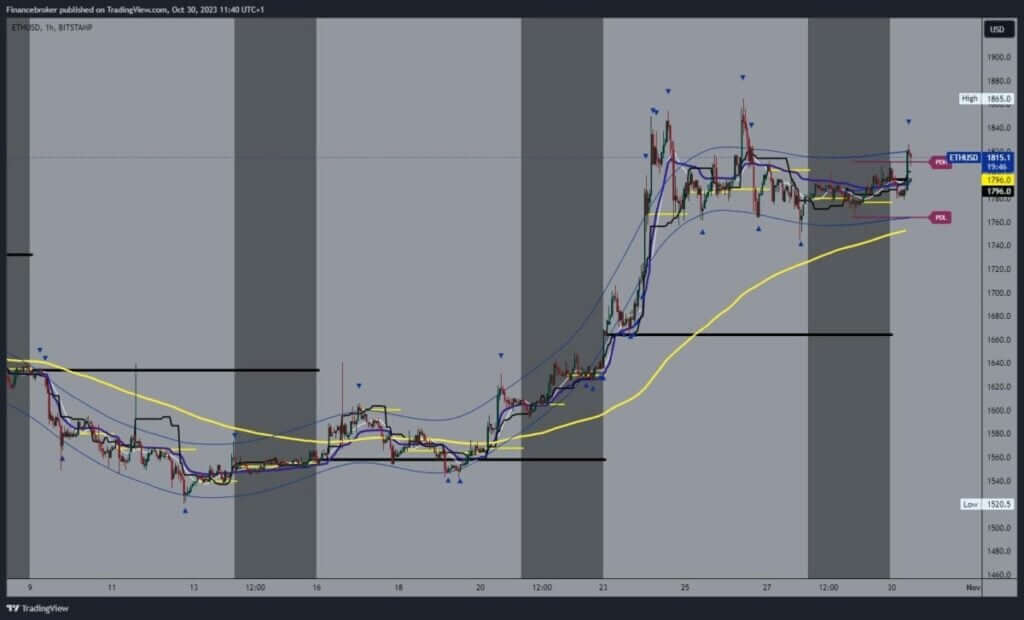 More By This Author:Dogecoin And Shiba Inu: Dogecoin Is Holding Above 0.07000 Bitcoin And Ethereum: Bitcoin Remains Stable Above $33500 Qualcomm Will Use Wi-Fi For Next-Gen Smart Tech Earbuds


Leave A Comment