
Last Monday’s signals were not triggered, as none of the key levels were reached during that session.
Today’s BTC/USD Signals
Risk 0.75% per trade.
Trades may only be entered between 8am London time and 5pm New York time today.
Long Trades
The best method to identify a classic “price action reversal” is for an hourly candle to close, such as a pin bar, a doji, an outside or even just an engulfing candle with a higher close. You can exploit these levels or zones by watching the price action that occurs at the given levels.
BTC/USD Analysis
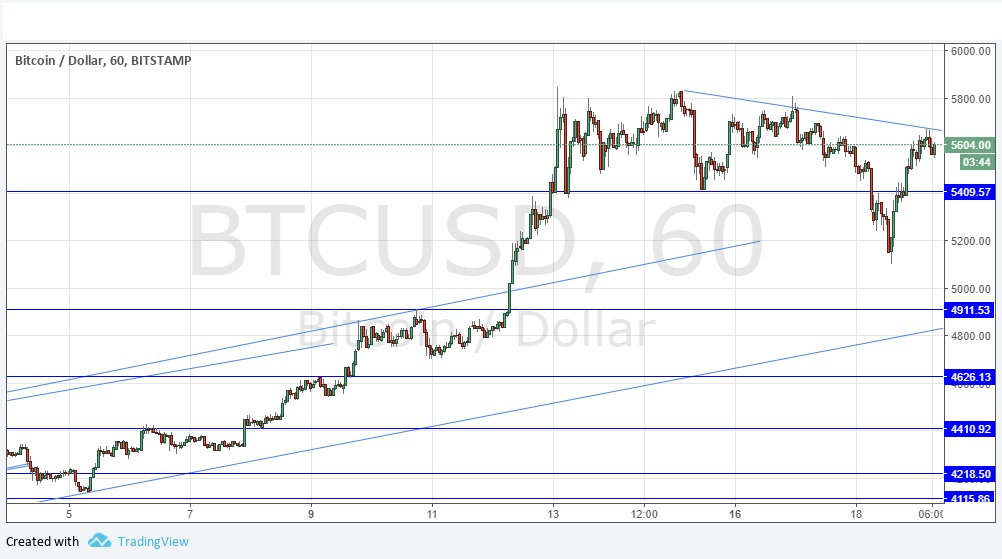
Although the price still has not been able to exceed the all-time high it made exactly one week ago and has dipped below two recent support levels while reaching as low as $5100.00, the picture still looks bullish. The support at $5409.57 has reasserted itself, and provided the price does not get much below $5100.00 I will remain bullish on Bitcoin for some time yet.
We do have an early, short-term bearish trend line connecting the week’s key swing highs, as shown in the chart below, and although it is not something worth getting too excited about yet, a sustained break above that trend line will make the outlook more bullish. Alternatively, if it holds for the rest of the week, a pull back to the $5100.00 area will become more likely to happen.


Leave A Comment