

Watch the video extracted from the WLGC session before the market open on 5 Dec 2023 below to find out the following:
Video Length: 00:06:44The bullish vs. bearish setup is 394 to 45 from the screenshot of my stock screener below pointing to a healthy and positive market environment.
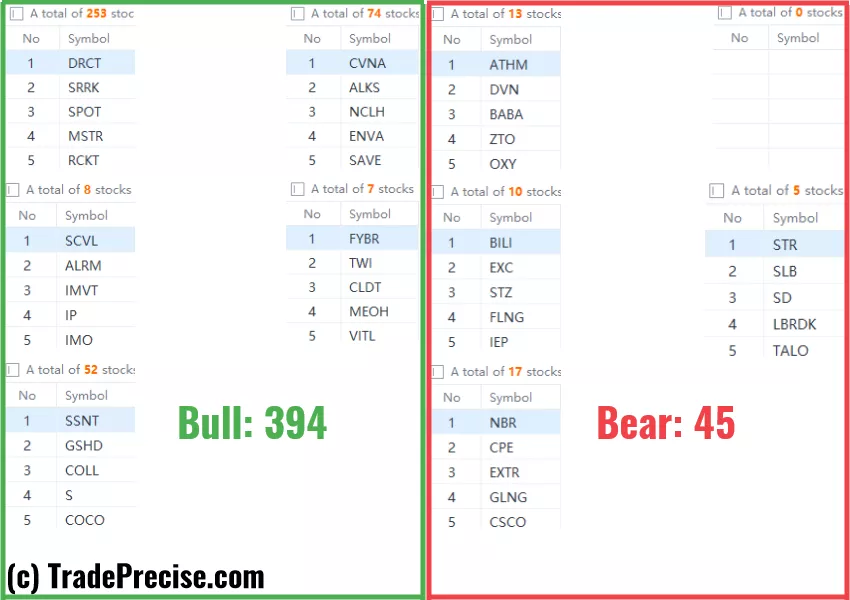
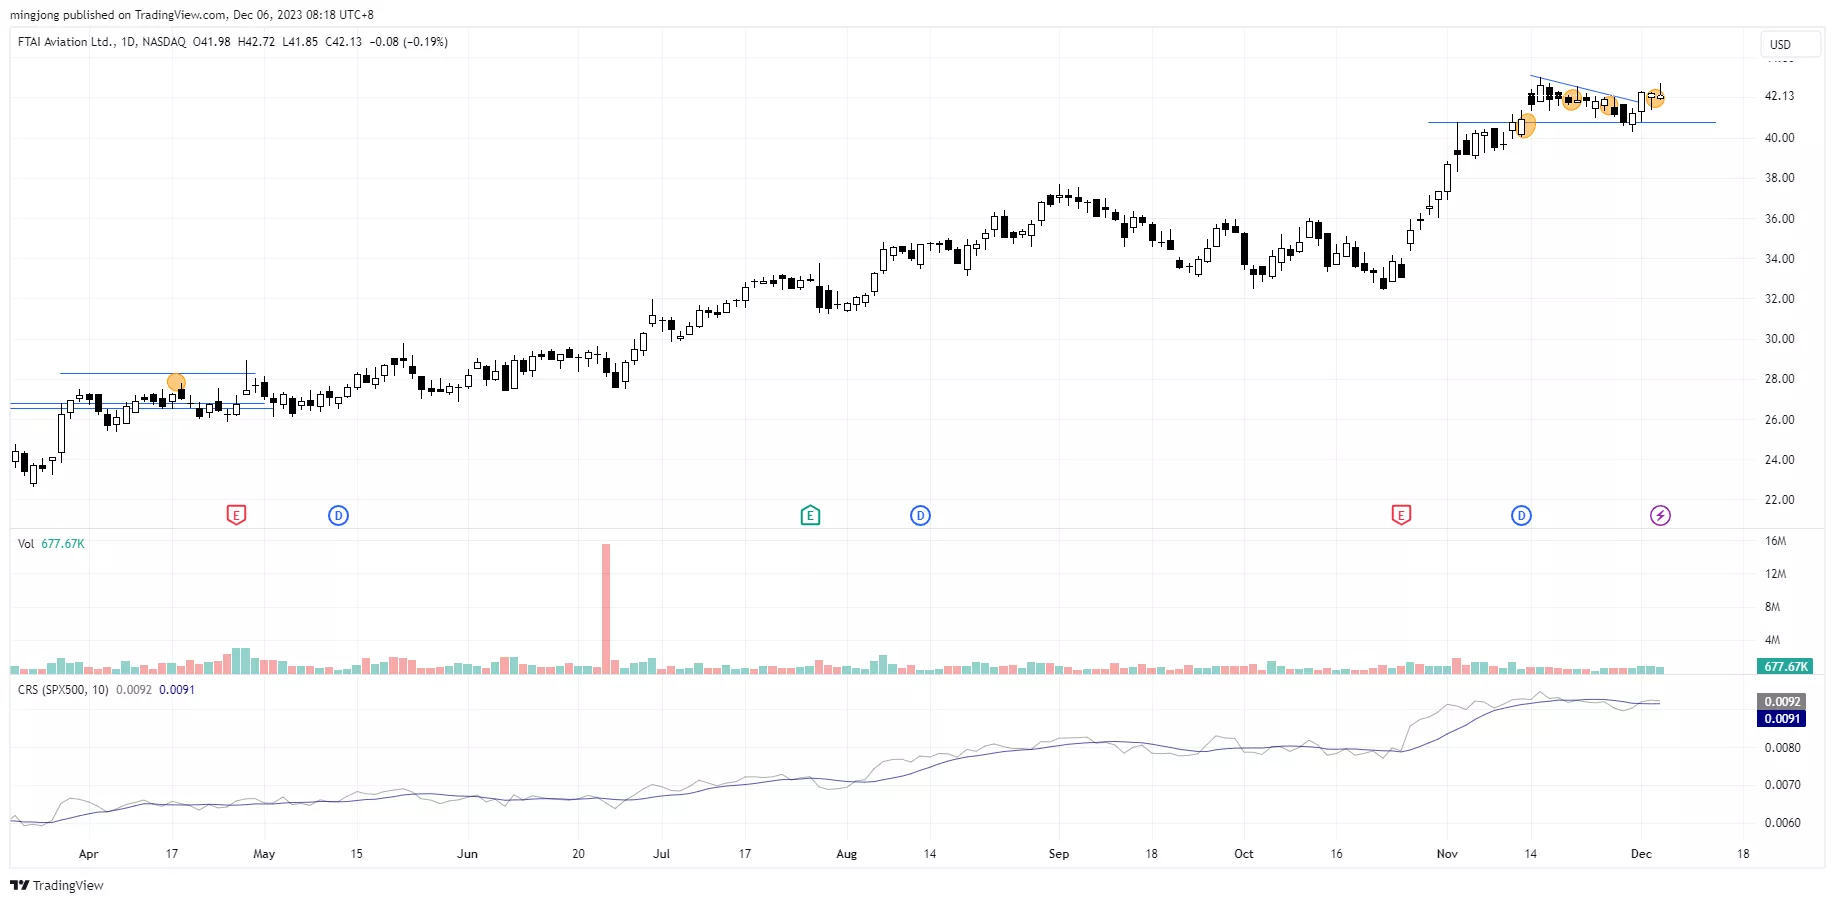
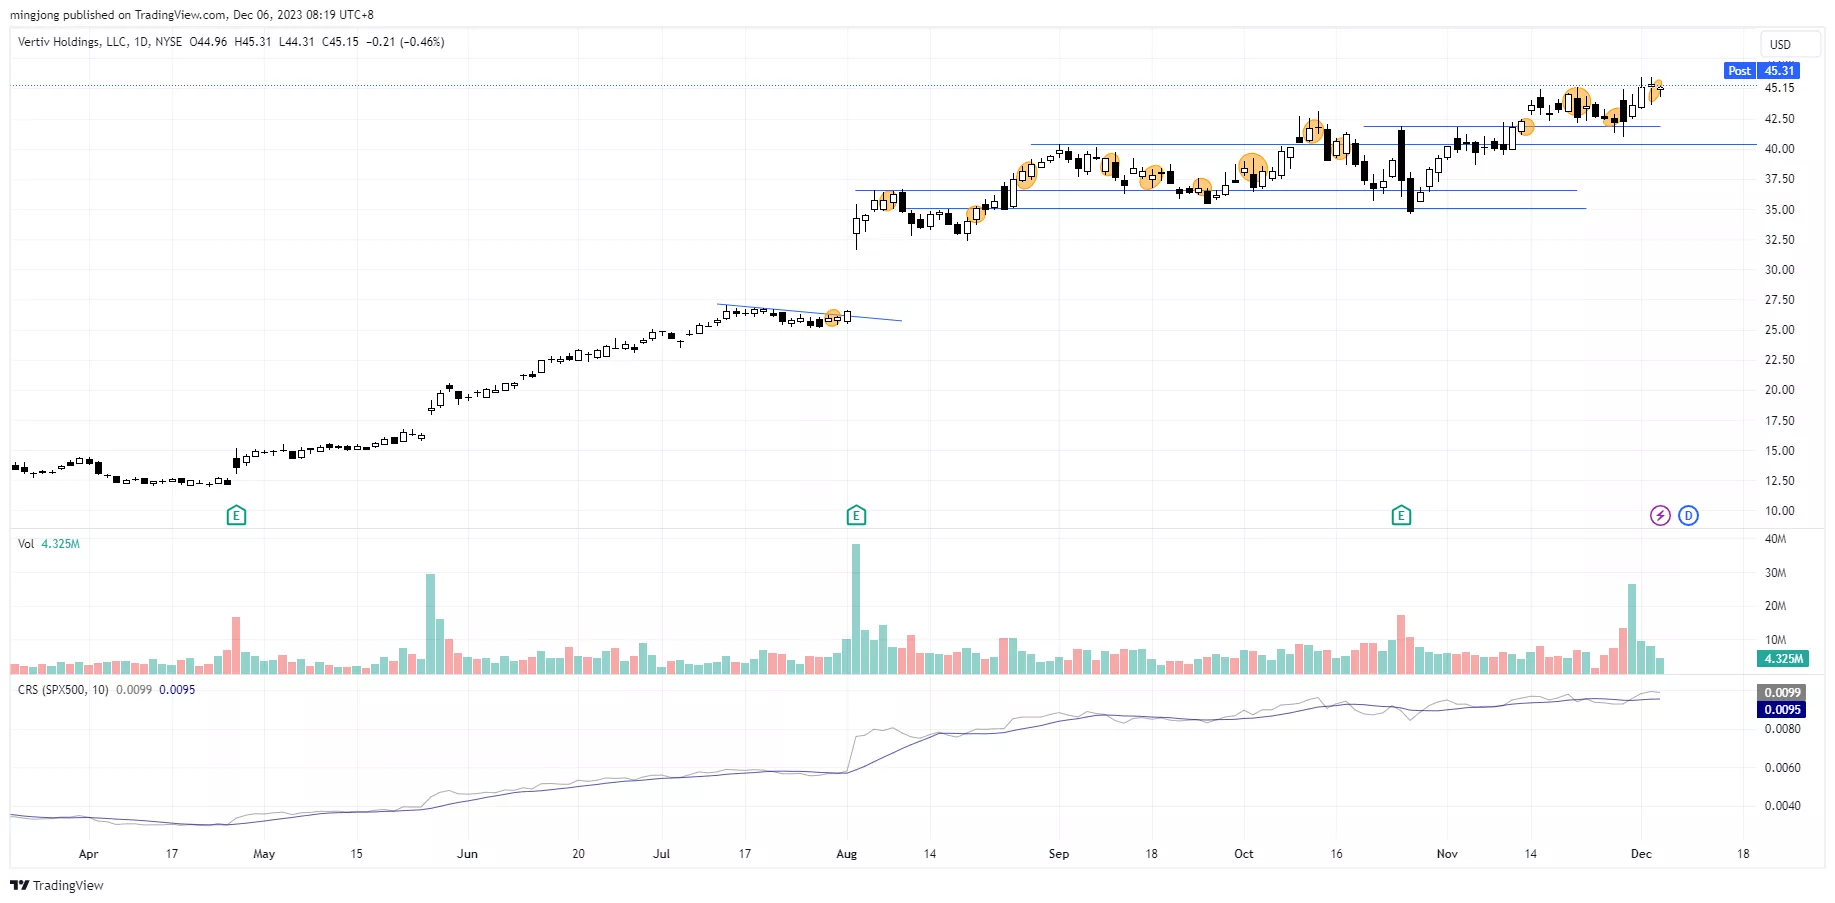
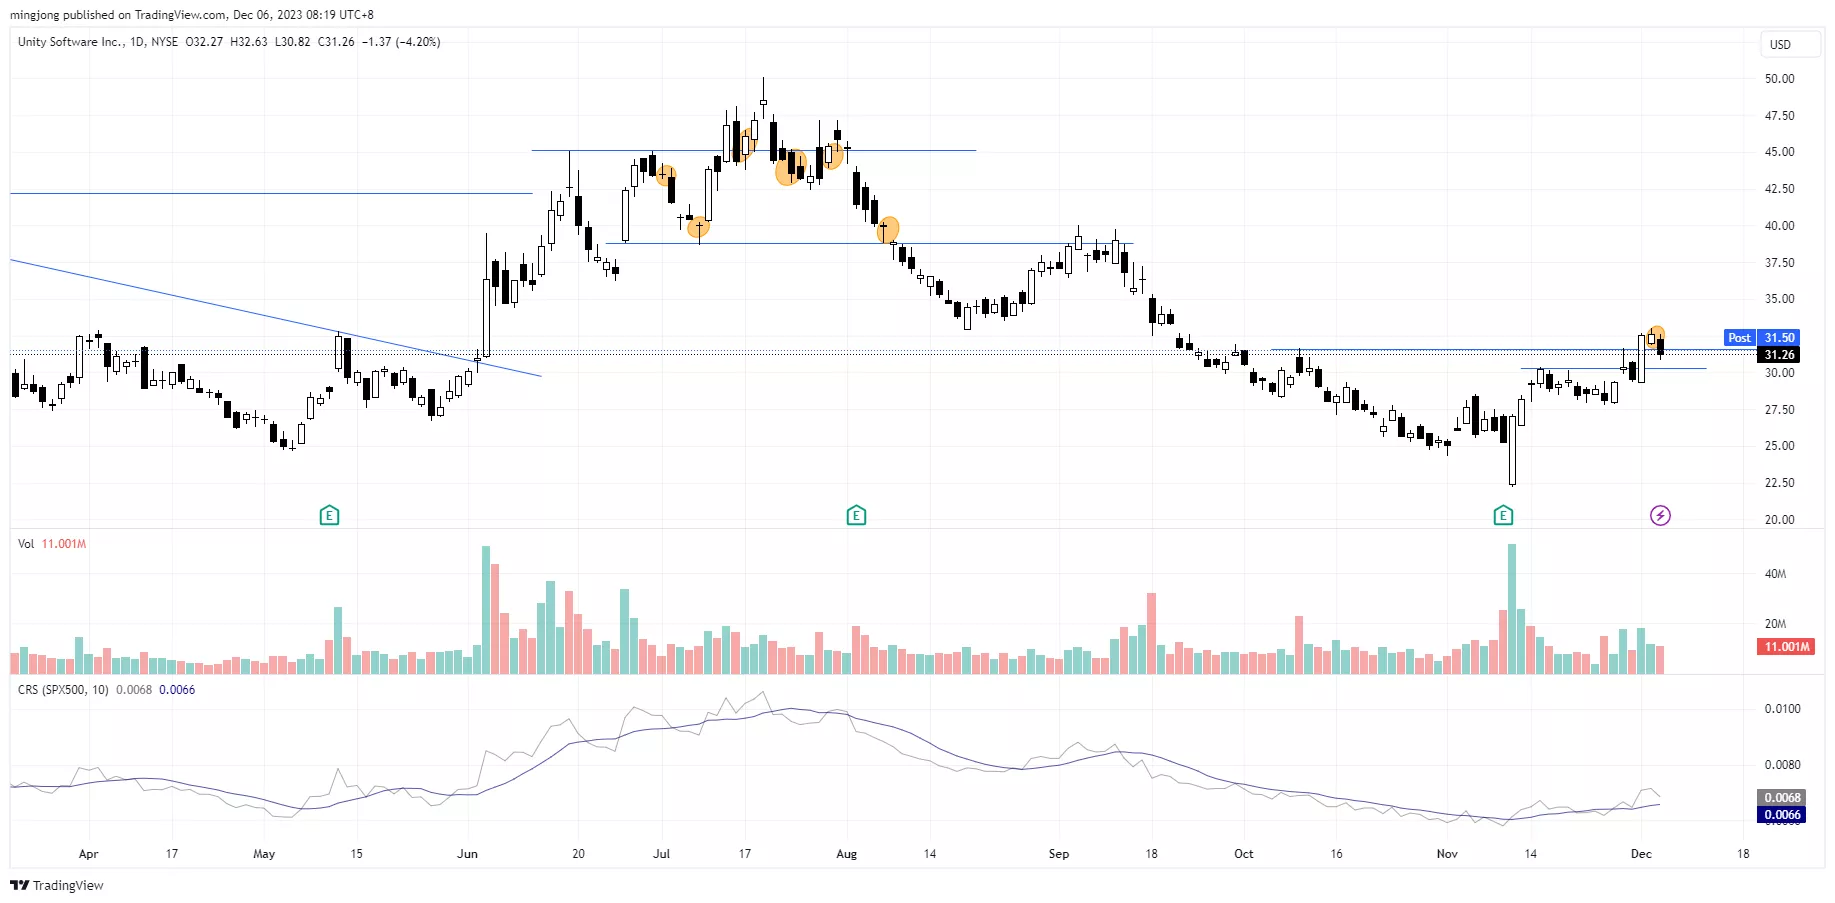
Both the long-term market breadth (200 MA & 150 MA) are above 50%, which are very healthy for a sustainable rally.The short-term market breadth (20 MA) is at the overbought level, which is a sign of strength. Watch out for a pullback/consolidation as some stocks are extended.9 “low-hanging fruits” (FTAI, VRT, etc…) trade entries setup + 19 others ( U etc…) plus 15 “wait and hold” candidates have been discussed during the live session before the market open (BMO).
More By This Author:Russell 2000 Roars Back: Unveiling The Bullish Flag That Could Ignite The Next Big Market Rotation
Tired Bull Or Ready For Another Charge? Decoding The Up Momentum Puzzle
Riding The FOMO Wave: How To Scale In And Win Big In This Unstoppable Rally


Leave A Comment