According to a projection from trade group Cruise Lines International Association, more than 25 million will take to the seas using cruise ships this year. As of Dec 2016, 26 new ships had been, of which ocean vessels amounted to $6.8 billion. A majority of travel agents expect cruise sales to increase this year. During 2005-15, the demand for cruises experienced a 62% jump.
Industry insiders expect the demand for cruise ships to remain strong this year. Their attractive pricing versus land based trips and their wide ranging appeal are other factors which give them an advantage. As investments, they stand out for their comparatively reasonable valuations and long-term potential. These are the investments you would buy and hold for extended periods for solid returns.
Stocks Under Consideration
The two leading U.S. listed cruise lines, Carnival Corporation (CCL – Free Report) and Royal Caribbean Cruises Ltd. (RCL – Free Report) are the ones you would probably be considering if you’re looking to invest in the vacations segment. With summer holidays around the corner, this is the best time to determine which of these is a better stock.While Carnival has a Zacks Rank #3 (Hold), Royal Caribbean Cruises carries a Zacks Rank #2 (Buy).
Other major operators in the cruise segment include Norwegian Cruise Line Holdings Ltd. (NCLH – Free Report) and Disney (DIS – Free Report) . The entertainment behemoth has a small but impressive line of ships and a private island in the Bahamas for stopovers to boot.
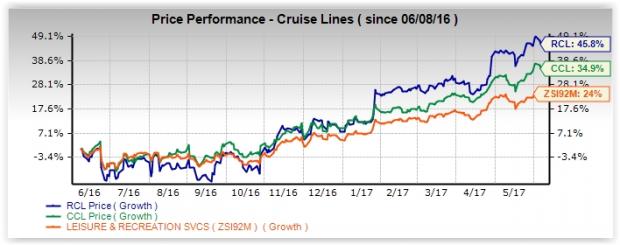
Price Performance
The Zacks Leisure And Recreation Services industry has posted a stellar performance over the last year, gaining a substantial 24%. Both Royal Caribbean and Carnival have outperformed the broader industry. But the smaller of the two stands out with a return of 45.8% while Carnival has gained 34.9% over the last year.

Valuation
The most appropriate ratio to evaluate these two cruise lines is EV/EBITA. This metric is commonly used for several media sub groups as well as chemicals, gaming, bus and rail industries. This metric is preferred when it becomes inappropriate to use EBITDA because of wide differences between the two companies’ asset financing patterns. This refers to the mix of ownership, rentals and leases.


Leave A Comment