
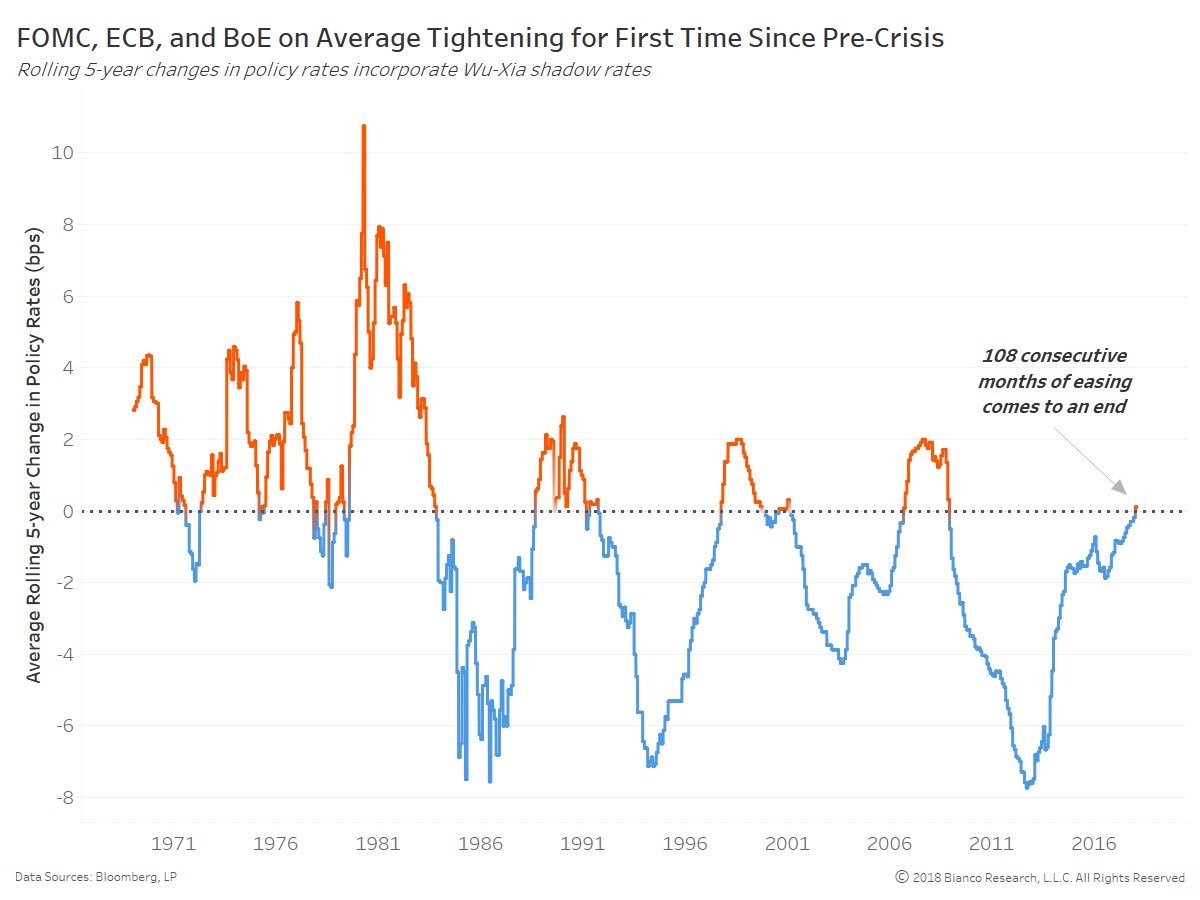
The chart below is very interesting because it combines the Bank of England, the Fed, and the ECB’s policy to come up with a rolling 5 year average of rate changes. I would have used a three year average because I feel that five years is too delayed and because an entire business cycle is only a bit more than five years. The other obvious criticism of the chart is it includes the Bank of England instead of the Bank of Japan which is still going strong with its QE program and negative rates.
The coolest part of this chart is it includes the shadow rates which means it counts QE and balance sheet reductions. That affects the recent results in that it sends the 2012 trough lower and it pushes the current value higher. The ECB’s interest rate is still below zero and the QE is still €30 billion per month, but the hawkish expectations have advanced. The ECB will probably end QE in September and raise rates 10 basis points before the end of the year. The Bank of England is dealing with the negative economic effects of Brexit, so it still has its interest rate at 0.5%. The Bank of England’s balance sheet as a percentage of GDP peaked at 24.13% in 2013 and has fallen slightly since then.
The obvious reason this chart has moved towards the hawkish end after nine years of being dovish is that the Fed has raised rates and has started to unwind QE. On Tuesday, Fed chair Powell will speak at a conference for the first time since being named chair. This will get the market up to speed on his plans for policy as the Fed is probably about halfway through the hike cycle and less than a quarter of the way through the balance sheet reduction cycle. This speech will tell the market what the Fed will do at the March meeting in 25 days. The Fed fund futures are pricing in an 83.1% chance of a rate hike.
The obvious takeaway from this chart is that the business cycle is nearing its end. It appears the monetary policy usually stays on the hawkish side for 2-3 years before a recession. Since the Fed, ECB, and possibly the Bank of England will be raising rates this year and will be headed in a hawkish direction with their balance sheets, this line will increase in the next 12-24 months. One important point is this shows the change in policy, which can be different from the actual effect on the economy. What I mean by that is the Fed has raised rates which means it’s going in the hawkish direction, but the overall policy is still dovish since the Fed funds rate is below the Taylor Rule and the CPI.


Leave A Comment