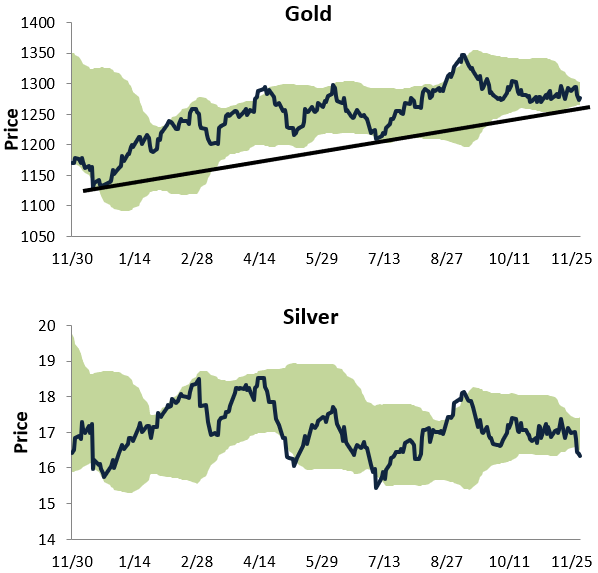
Below we take a look at one-year trading range charts for gold, silver, oil, and natural gas. For each chart, the green shading represents between two standard deviations above and below the commodity’s 50-day moving average. Moves to the top of or above the green shading are considered overbought, while moves to the bottom of or below the green shading are considered oversold.
While gold has been flat as a pancake lately, it has been holding just above the bottom of its uptrend support line. Gold bulls are hoping this sideways period is just a re-charge for a big move higher back towards the top of the channel.
Silver looks much different than gold, with a slightly downward sloping pattern over the last year. Just this week, we’ve seen silver move into oversold territory. While oversold levels eventually result in mean reversion (to the upside), if we were trading silver, we’d wait for it to break out to a new 52-week high before buying.

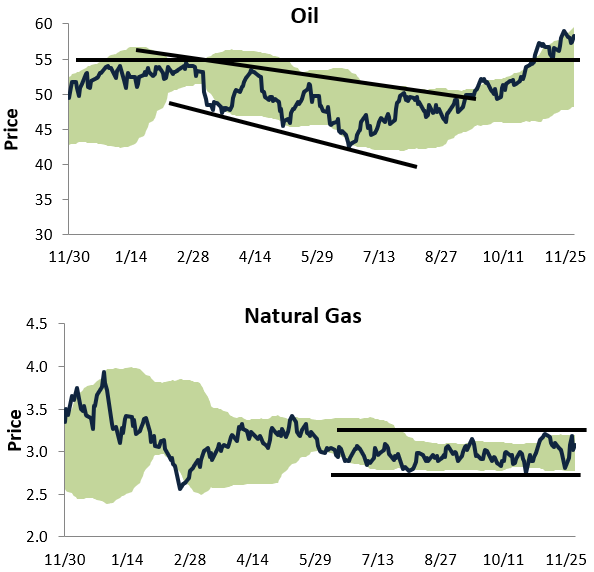
Oil has had a very nice run over the last five months.In October it finally broke out of a long-term downtrend channel, and it recently formed a new uptrend channel when it broke out to new 52-week highs.
Natural gas has been trading in a sideways range around the $3 mark for six months now.The sideways trend is better than the downtrend that had been in place, and now natural gas bulls want to see a breakout above the top of this range so that a new uptrend can form.


Leave A Comment