Citigroup (C) more than tripled its quarterly dividend earlier this year, but few people can forget the terror of the 2008-2009 financial crisis. Unlike our favorite recession-resistant dividend stocks, some of the world’s largest financial institutions were on the brink of utter collapse and threatened to plunge the global economy into a prolonged depression.
Citigroup was among the largest of the megabanks to require a government bailout, with the US government pumping $45 billion into the bank in order to cover losses on $301 billion in toxic mortgage assets.
However, since that time new regulations and a new management team at Citigroup have made an impressive, if still incomplete turnaround. This could create potential for long-term, deep value dividend investors building their portfolios to get in on the ground floor of what could become a great, if still risky, dividend growth stock.
Let’s take a look at Citigroup’s business and, more importantly, what changes management has made to ensure that one of the world’s largest banks never comes close to wiping out both the global economy, and shareholders, again.
Business Description
Citigroup is America’s 4th largest bank, but the smallest of the four megabanks, which include JPMorgan Chase (JPM), Wells Fargo (WFC), and Bank of America (BAC). It operates in over 160 countries, serves over 200 million retail customers, is the world’s largest issuer of credit cards, and is one of the largest banks in the world with almost $1.4 trillion in total assets.
Citigroup’s business can be broken down into three segments:
North American Consumer Banking
Retail banking and credit cards:
Q3 2016 % of total sales: 26.2%
Q3 2016 % of total net income: 25.2%
International Consumer Banking
Retail banking and credit cards outside North America:
Q3 2016 % of total sales: 17.3%
Q3 2016 % of total net income: 14.2%
Institutional Clients Group
Institutional asset management, investment banking, corporate lending, and stock and bond trading:
Q3 2016 % of total sales: 45.1%
Q3 2016 % of total net income: 53.7%
Business Analysis
There are numerous metrics needed to understand banks, but the five most important are: earnings per share (from which dividends are paid), tangible book value per share (the underlying intrinsic value of the bank’s net assets), common equity Tier 1 capital (which represents how secure the balance sheet is), the efficiency ratio (what portion of revenue goes towards funding operations), and the dividend payout ratio (security of the current payout).
Citigroup’s turnaround is thanks to its much better management team. For example, compared to his predecessor Vikram Pandit, whose expertise was in investment banking and hedge funds, Michael Corbat, CEO since 2012, is a better-rounded banker. Specifically, Corbat served in numerous consumer banking roles around the globe, as well as the CEO of the company’s wealth management division.
Under his leadership, as well as that of Chairman Michael O’Neill, who successfully turned around Bank of Hawaii (BOH), the company has focused on becoming a much sounder, leaner, and more conservative bank.
This has so far resulted in a focus on three main areas: cost cutting, selling off poorly performing assets (such as its Brazilian, and Argentinian retail arms, and Japanese brokerage division), and strengthening the bank’s balance sheet.
For example, Corbat has overseen the closing of many of Citigroup’s less profitable branches and the laying off of employees, starting with 84 locations and 11,000 workers in 2013 that saved the bank $900 million per year.
Thanks to such efforts, for the first nine months of 2016 Citigroup has an efficiency ratio (operating expenses/revenue) of just 56%, down 3% from last year and the lowest of all the US megabanks.
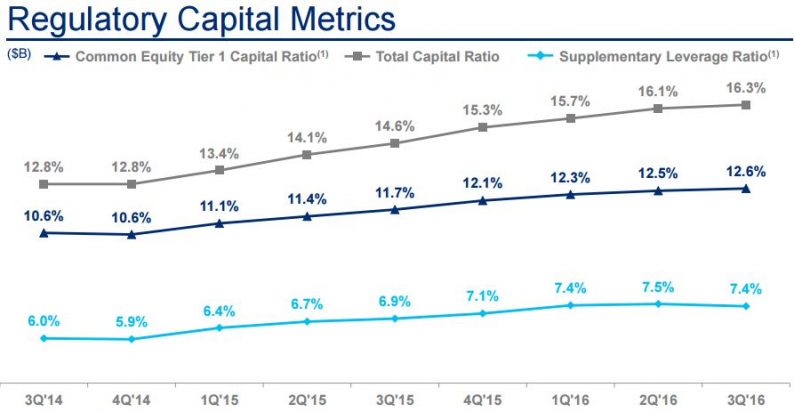
More importantly from the perspective of shareholders, who want to avoid another 2009 meltdown, the balance sheet is the strongest it’s ever been. Specifically this can be seen with the growth in the bank’s common equity tier 1 capital ratio, or CET1.
Common equity tier 1 capital is just shareholder equity (net assets) plus the bank’s retained earnings over time. It represents the bank’s core capital and what must absorb any losses the bank may face during an economic downturn.
The CET1 is the ratio of common equity tier 1 capital to the bank’s risk-weighted assets, with the limit set by regulators based on a bank’s size and strategic importance to the global economy. Citigroup’s minimum CET1 is 9.0% but as you can see, management has been methodically improving this ratio far over that minimum.

Source: Citigroup Earnings Presentation
In fact, Citigroup’s CET1 is now at the highest level in the bank’s history and a big reason that the Federal Reserve recently allowed the bank to more than triple its quarterly dividend from 5 cents per share to 16 cents earlier this year.
However, as impressive as Citi’s turnaround has been, that doesn’t mean the bank still doesn’t have a long way to go to achieve the same quality standards as best in breed rivals, JPMorgan Chase and Wells Fargo.
Thanks to interest rates remaining near zero in the US, and at their lowest level in history worldwide, Citigroup has struggled to boost its sales, and earnings.
In fact, year-to-date the bank’s revenue and EPS are down 8%, and 17%, respectively. That’s despite a 4% reduction in expenses and a solid 4% reduction in share count, courtesy of the bank’s aggressive buyback program.
The declining earnings are mainly a result of Citigroup’s net interest margin, the spread between its borrowing and lending costs, being under pressure by continued low interest rates.

Now there is good news for Citigroup on this front. Should interest rates rise by even 1% in the US, Citigroup’s net income would rise by $1.4 billion, or roughly 10% compared to the last 12 months (according to the company’s 10-Q).


Leave A Comment