
We’ve seen a valiant effort by the bulls to bring US equity futures back into the black after some moderate declines earlier this morning, but the just-released September Retail Sales report isn’t helping matters as the headline reading came in weaker than expected (+0.1% act vs +0.6% exp). Ex Autos, the September reading was even weaker showing a decline of 0.1%, which was the weakest monthly reading since May 2017.
As we enter a new trading week, I just wanted to provide a brief synopsis of where stocks in various sectors and market cap ranges stand relative to their 52-week highs.
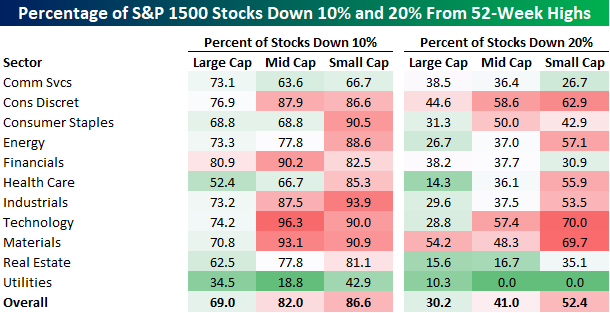
The table below shows the percentage of stocks in each sector (grouped by market cap) that are down 10% and 20% from their 52-week highs.
For the S&P 500 as a whole, 69% of stocks are down an at least 10% from their highs, while 30% are down over 20%. The numbers for small caps are even worse with 86.6% down more than 10% and over half down 20%+.


Leave A Comment