
Following futures positions of non-commercials are as of December 12, 2023.10-year note: Currently net short 556.9k, down 79.5k.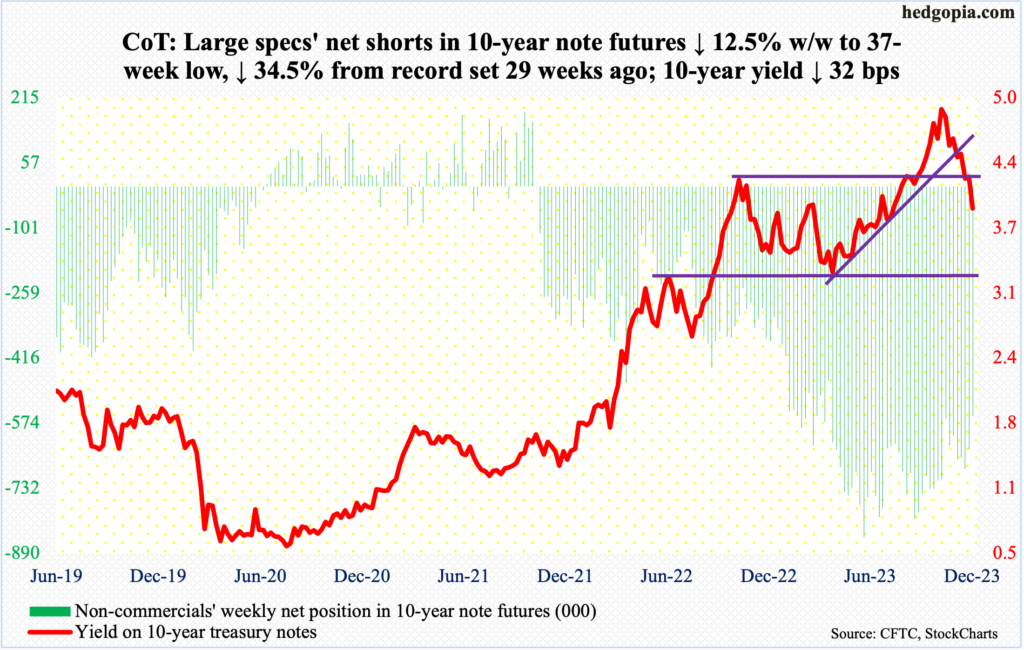 By making a sharp dovish turn, the Federal Reserve has let loose animal spirits in risk-on assets. This week’s FOMC meeting was not a surprise in that the fed funds rate was left unchanged at a range of 525 basis points to 550 basis points, up from zero to 25 basis points in March last year. But it was a huge surprise from the viewpoint of their rates outlook. The dot plot now expects up to three 25-basis-point cuts next year, up from two during the September meeting.Going into the meeting, futures traders were pricing in four cuts next year. Post-FOMC, they have raised that to six, expecting the benchmark rates to hit 375 basis points to 400 basis points by the end of 2024. Rightly or wrongly, markets are beginning to sense a Fed that now seems ready to acquiesce to their demands.It is an interesting pivot on the part of the Jerome Powell-led central bank. Justification could range from a sustained drop in inflation from last year’s four-decade highs – although still much higher than the Fed’s targeted two percent – to soaring interest payments of the federal government to undisclosed expectations of a sharp economic deceleration associated with the desire to ignite the so-called wealth effect (more on this here). Or it could simply be a desire not to let the economy slip into a recession in an election year. Whatever the motive, the Fed at the same time is risking a resurgence in inflation should equities continue to get bid up, which then sets in motion a virtuous cycle of consumer spending in the quarters to come.30-year bond: Currently net short 136.3k, up 6.2k.
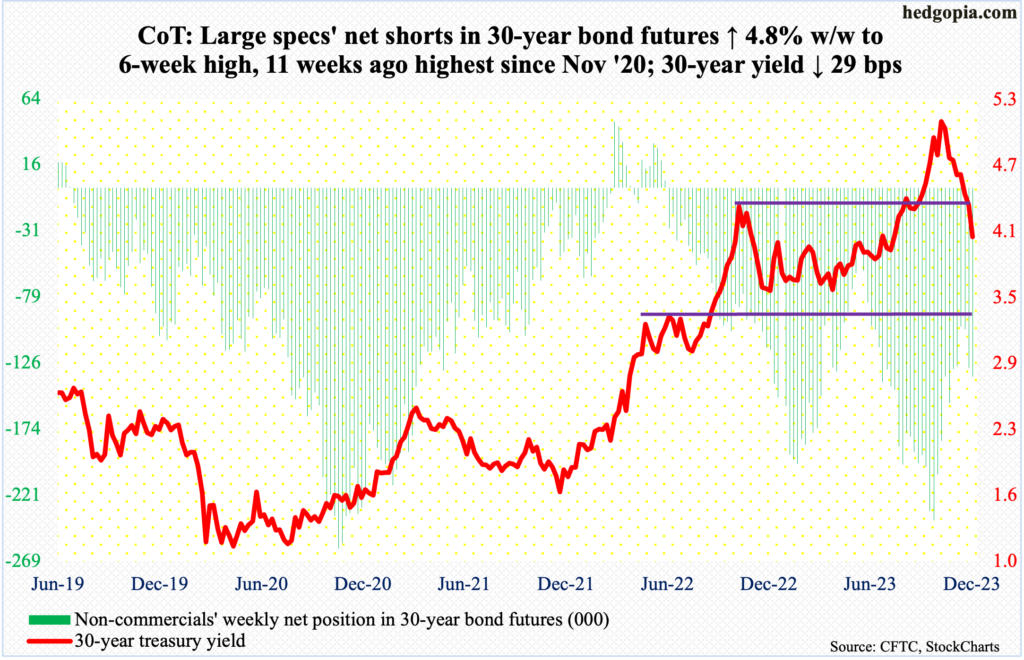 Major US economic releases for next week are as follows.The NAHB Housing Market Index (December) is due out Monday. Homebuilder confidence decreased four points month-over-month in November to 40 – a 10-month low. Last December’s 31 was the lowest since April 2020.Housing starts (November) are scheduled for Tuesday. Starts increased 1.9 percent m/m in October to a seasonally adjusted annual rate of 1.37 million units. August starts of 1.31 million were the lowest since June 2020.On Wednesday, existing home sales (November) are released. Sales declined 4.1 percent m/m and 14.6 percent from a year ago in October to 3.79 million units (SAAR).GDP (3Q23, third and final estimate) and corporate profits (3Q23, revised) come out Thursday.The second estimate showed real GDP jumped at an annualized rate of 5.2 percent last quarter, which is the best quarterly showing since 4Q21.Corporate profits adjusted for inventory valuation and capital consumption grew 3.3 percent quarter-over-quarter in the September quarter to $3.28 trillion, not too far away from the record $3.3 trillion reached in 3Q22.Friday brings durable goods orders (November), personal income/spending (November), new home sales (November) and the University of Michigan’s consumer sentiment index (December, final).Orders for non-defense capital goods ex-aircraft – proxy for business capex plans – fell 0.3 percent m/m in October to $73.6 billion (SAAR). August set a new high of $74 billion.In the 12 months to October, headline and core PCE (personal consumption expenditures) respectively rose three percent and 3.5 percent. They peaked last year in June and February respectively at 7.1 percent and 5.6 percent.October sales of new homes were down 5.6 percent m/m to 679,000 units (SAAR) – a two-month low.December’s preliminary reading showed consumer sentiment shot up 8.1 points m/m to 69.4, which matched August’s reading. In June last year, sentiment reached a record low 50.WTI crude oil: Currently net long 162.2k, down 7.8k.
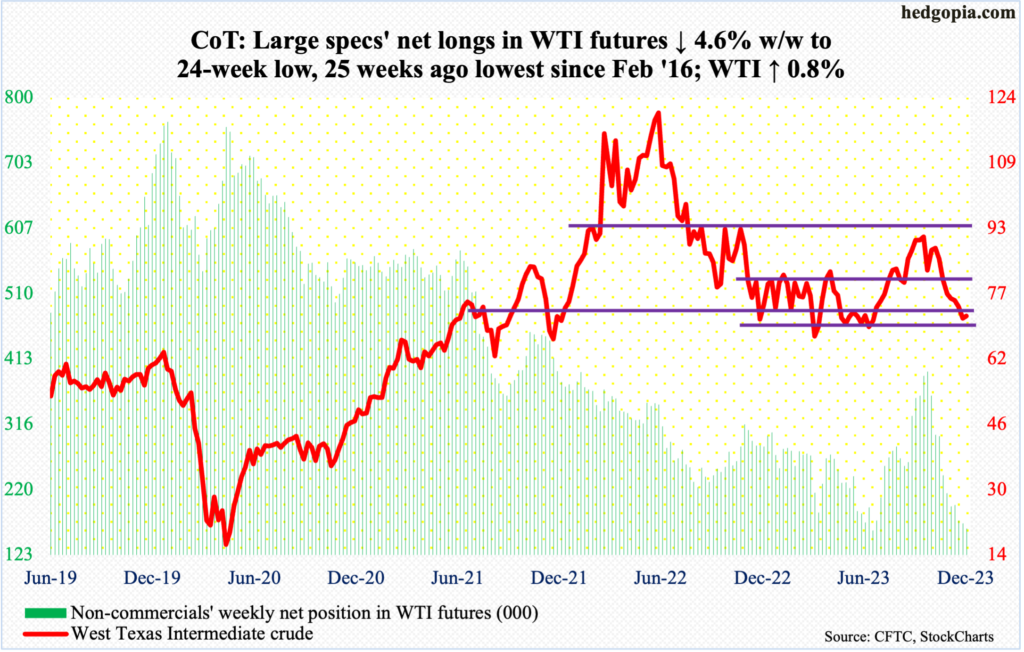 Last week’s low of $68.80 was undercut this week as West Texas Intermediate crude dropped as low as $67.71 on Wednesday but only to then reverse higher to end the week up 0.8 percent to $71.78/barrel.Once again, the crude fell out of a one-year range between $71-$72 and $81-$82 intraweek but the damage was undone by the end of the week.The daily is oversold, and a rally is possible. On both Thursday and Friday, oil bulls tried to take out the November 16th low of $72.37 on a closing basis but were denied. As this gets reclaimed, the 50-day – now flattish – at $73.58 will be the next one to go.In the meantime, as per the EIA, US crude production in the week to December 8th was unchanged week-over-week at 13.1 million barrels per day. Before this, output remained unchanged at a record 13.2 mb/d for eight weeks in a row. Crude imports decreased 991,000 b/d to 6.5 mb/d. As did crude inventory, which dropped 4.3 million barrels to 440.8 million barrels. Stocks of gasoline and distillates, however, respectively grew 409,000 barrels and 1.5 million barrels to 224 million barrels and 113.5 million barrels. Refinery utilization was down three-tenths of a percentage point to 90.2 percent.E-mini S&P 500: Currently net short 65.1k, up 17.8k.
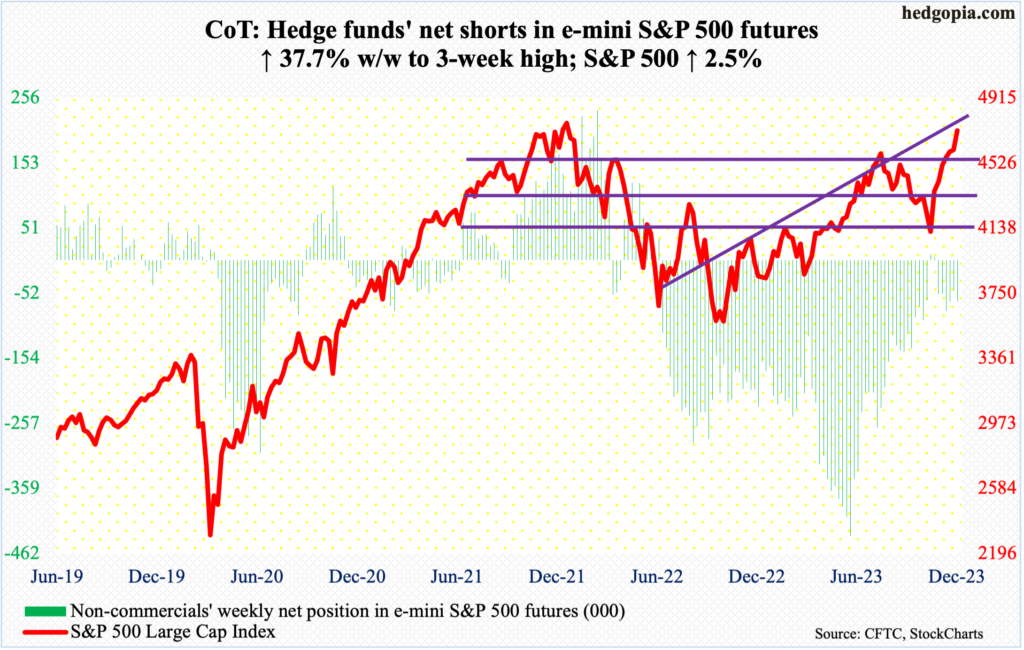 Going into this week, the S&P 500 was already up six weeks in a row, having bottomed on October 27th at 4104. By Tuesday, the large cap index had already rallied past the July 27th high of 4607. Wednesday’s FOMC pivot was used as an excuse to further build on this positive momentum. The week finished up 2.5 percent to 4719. The record high of 4819 from January last year is merely 100 points away.Amidst this, a spinning top showed up Thursday, followed by a similar candle Friday. Even after the relentless seven-week rally, the weekly RSI (67) is yet to touch 70, a fact that could encourage the bulls to try to squeeze more gains out of the current momentum.That said, the daily RSI closed out the week at 79. The last time this metric was as overbought was in September 2020, when the index gave back over 10 percent in three weeks. At a time like this when literally everyone seems to be on one side of the boat, surprises can spring up out of nowhere.Euro: Currently net long 147.3k, down 5k.
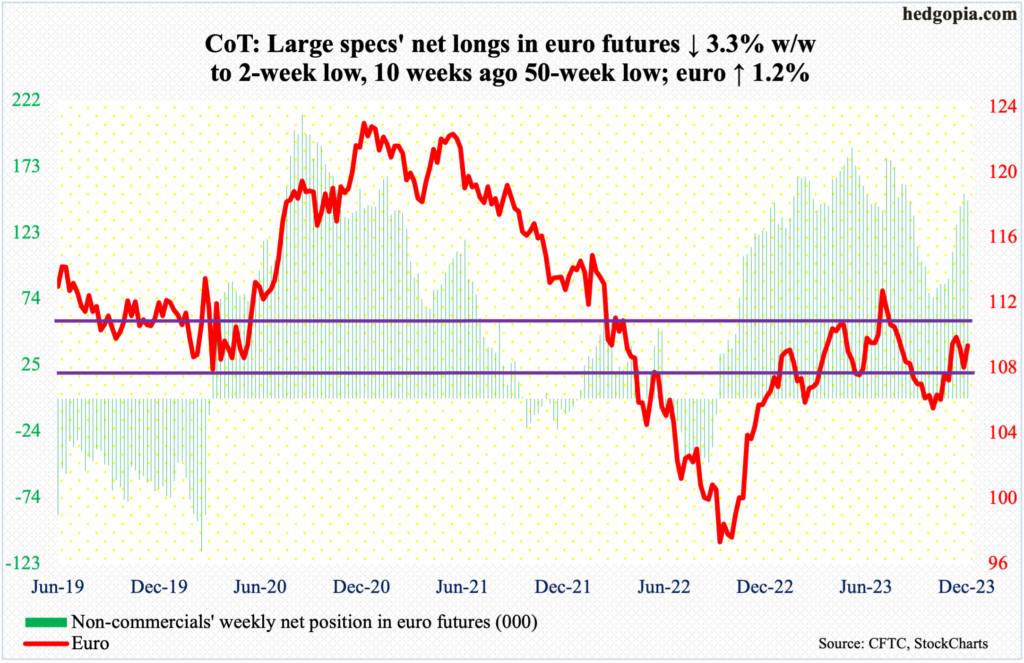 The euro firmed up 1.2 percent this week. The gains came as the dollar weakened on Wednesday post-FOMC, followed by European Central Bank President Christine Lagarde’s comment after the bank had its policy meeting on Thursday that they did not even discuss rate cuts for next year.Euro bulls attacked the $1.10 resistance with an intraday high of $1.1011 on Thursday but were rejected. The currency has been under pressure since tagging $1.1011 on November 28th. This needs to go if the bulls were to build on this week’s momentum.Gold: Currently net long 188.2k, down 15.3k.
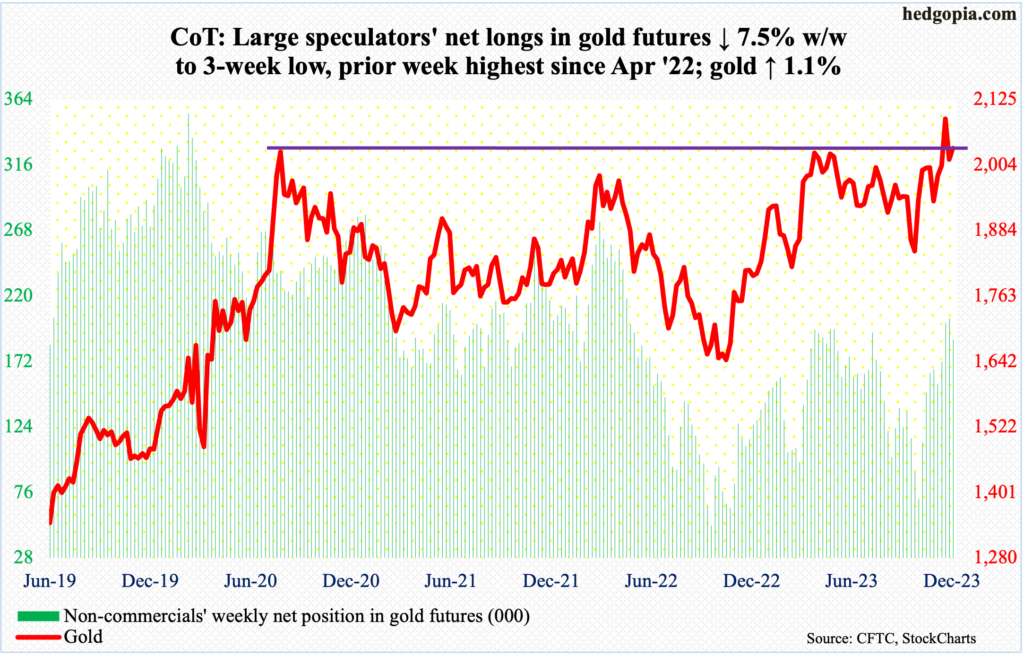 Gold bugs rallied the metal 1.1 percent this week to $2,036/ounce but remain on the defensive after last week’s potentially important reversal.Last week, no sooner did gold break out of $2,080s than it quickly met with a nasty reversal. This level has a lot of memory attached to it. In August 2020, gold posted a new all-time high of $2,089 and retreated. The same thing happened in March last year when it printed $2,079 and in May this year when $2,085 was tagged.Bulls’ inability to recapture momentum soon will open the door to a test of the 50- and 200-day at $1,985 and $1,965 respectively.The risk is if non-commercials, who are decently long, decide to cut down their net longs.Nasdaq 100 index (mini): Currently net long 8.1k, down 298.
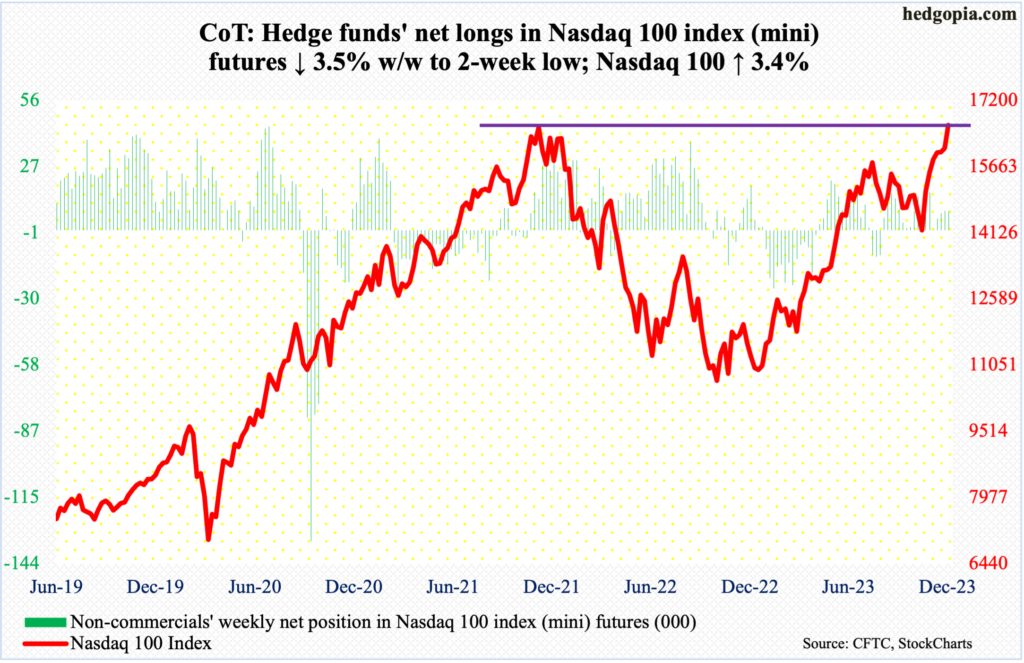 On a closing basis, this week’s close of 16623 set a new high, but the Nasdaq 100 is yet to surpass the November 2021 record high of 16765; this week, it rose as high as 16670 on Friday.The tech-heavy index’s 3.4-percent jump this week made up a seventh up week in succession. Momentum is strong, with the daily RSI at 75, matching July’s reading, which was when the index peaked at 15932 and proceeded to give back a little less than 12 percent in the next 14 weeks.In the event of a drawdown, nearest support lies at 16100s.Russell 2000 mini-index: Currently net short 50.6k, down 4.8k.
 On the back of a Fed pivot, small-cap bulls went on a rampage this week, rallying the Russell 2000 5.5 percent. More important, the small cap index broke out of a 200-point range that has been in place since January last year.Since it first bottomed in June last year at 1642, the Russell 2000 reclaimed 1900 at least three times – only to then rally to just north of 2000 and then retreat. This time around, Friday’s high of 2009 surpassed this year’s highs of 2007 (February) and 2004 (July), but not the August 2022 high of 2030. Before that even happens, Friday witnessed a mini-reversal, ending the session/week at 1985.Thursday’s gap-up gets filled at 1948, which for now is likely to act like a magnet.US Dollar Index: Currently net long 17.6k, down 2.3k.
 After failing to recapture 104 for seven sessions in a row including Wednesday, the US dollar index came undone in that session after the Fed delivered a dovish blow. For the week, it shed 1.7 percent to 102.18. Horizontal resistance at 103-104 goes back to at least December 2016.Thursday’s low of 101.39 has gained in significance for now. Dollar bulls cannot afford a breach.VIX: Currently net short 46.3k, down 10.6k.
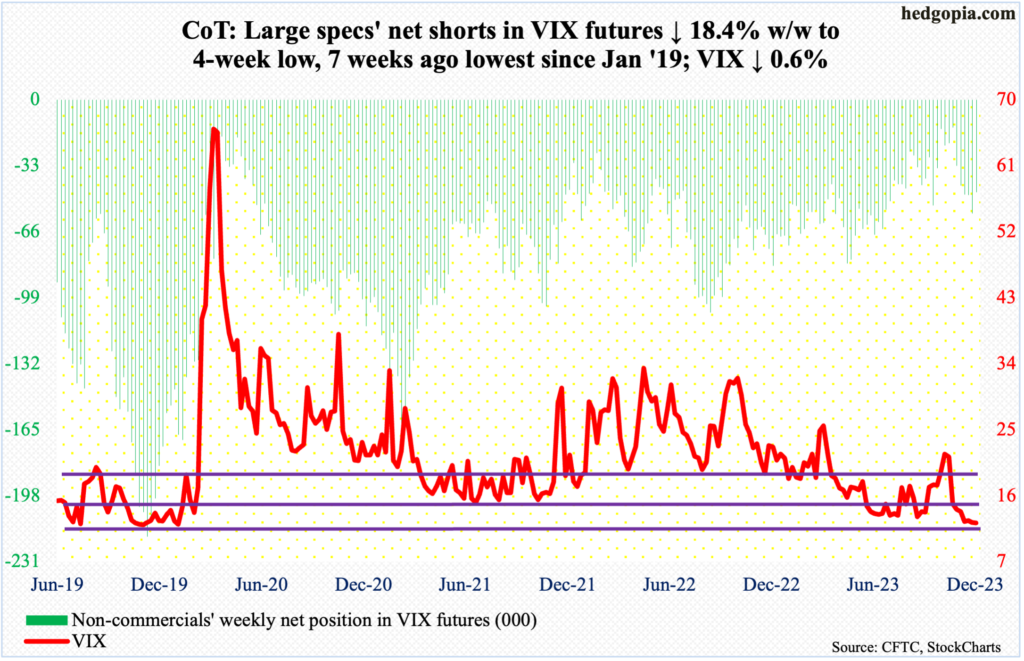 For three sessions from Tuesday through Thursday, VIX ticked the 11 handle intraday but only to finish north of 12. Even though the S&P 500 finished as strong as it did, the volatility index held its own at 12 at the daily lower Bollinger band. For the week, it dropped 0.07 point to 12.28.This comes even as the CBOE equity-only put-to-call ratio continues to flash a high level of complacency (more on this here). In 10 of the last 11 sessions, the ratio has produced readings of 0.50s, with the lone exception of 1.16 having – surprisingly – shown up on Wednesday when equities rallied vigorously post-FOMC.Amidst this, the daily Bollinger bands of VIX are narrowing. This precedes a sharp move – either up or down. Given it is currently at the low end of the range, a move higher is a safe assumption – timing and magnitude notwithstanding.Thanks for reading!More By This Author:Doves Fly, Bulls Run, Animal Spirits On Loose
Options-Related Sentiment Readings Can Begin To Flash Red Should S&P 500 Break Out Of July High Post-FOMC
CoT Report Analysis: What Large Specs, Noncommercials Are Buying


Leave A Comment