Yes, ’tis The Gold Update, but we’re compelled (as occasionally is our wont) to start with stocks’ suicide mission, given Gold in upside fruition (albeit still vastly undervalued) is doing just fine, thank you very much.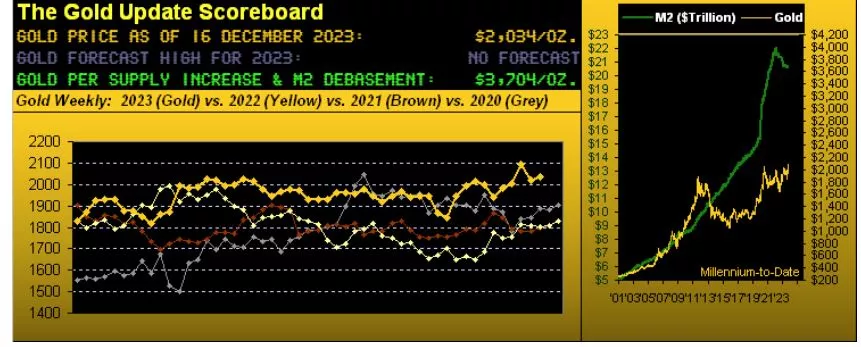 What is with this stock market, eh? As a great friend (with a long stint at basically the very top of a household-name investment bank … but we’ll maintain anonymity in this case) here recently remarked: “The stupidest people on Wall Street are the pension fund managers.”Ya think? Pros and rubes alike are throwing money like Pavlov’s drooling dogs on steroids into an S&P 500 index that is so beyond overvalued, further adjectives escape us. ‘Course as we’ve tweeted (@deMeadvillePro): mind the website’s S&P 500 MoneyFlow page to assess if the buying actually has substance.Still, we hear that apps with names like “Robinhood” allow for incredibly easy stock market access such that everyone’s gonna keep on buying and thus stocks shall only go even higher. To us that sounds more like being “robbed in the hood” as when the selling starts, the compounding of such shall overwhelm anything Wall Street and the World have ever seen. Because as you regular readers know: “The money isn’t there.”By the numbers:
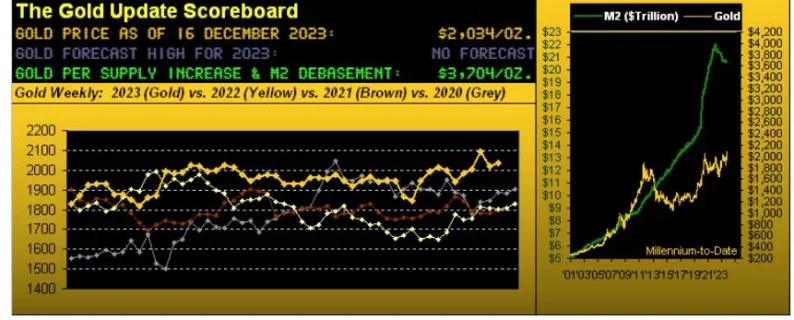
A dozen years ago in 2011, the market capitalization of the S&P 500 exceeded the U.S. liquid “M2” Money Supply by +29%; as of yesterday, that excess is +100%, the market cap now $41.3T versus an M2 of but $20.7T. (Wanna cause The Crash? Fax that last sentence over to CNBS for all the rubes watching their boob tubes).
Per yesterday’s (Friday’s) S&P settle at 4719, ’tis precisely -100 points (or just -2.1%) below the all-time intraday high of 4819 set on 04 January 2022; the current “expected daily trading range” for the S&P is now 34 points, meaning a new all-time high can be reached within 3 trading days, just in time for Christmas.
The number of consecutive trading days the S&P has been “textbook overbought” (a 44-year concoction of John Bollinger’s Bands, along with Relative Strength and Stochastics) is now 28 which is in the 93rd percentile of all such overbought conditions since the year 1980.
Present all-risk S&P 500 annualized dividend yield: 1.475%. Present no-risk U.S. 3-Month annualized T-Bill yield: 5.225%. (Why is this so hard to grasp?) “Because, mmb, T-Bills aren’t gonna double in price…” Just like stock’s can’t get halved, eh Squire? (‘Preciate the tee-up).
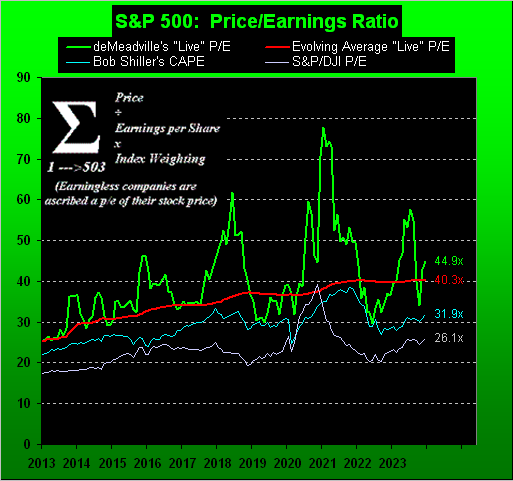
The “live” price/earnings ratio of the S&P settled the week at 44.9x; that is essentially double the 66-year average P/E of 22.8x (Shiller “CAPE” into deMeadville post-2012) and +77% up from when our “live” deMeadville version was instituted those 11 years ago at 25.4x:
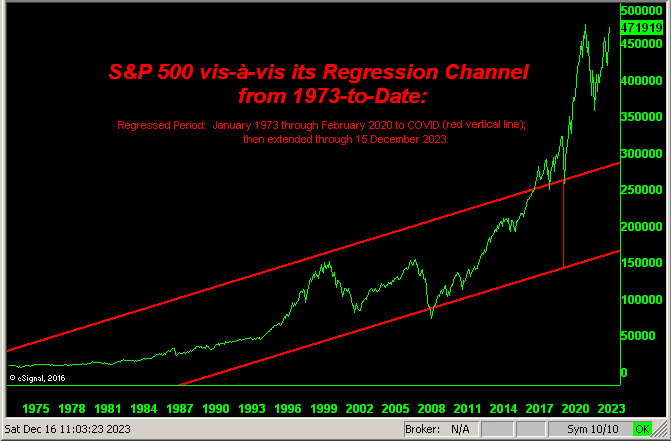
Next, too, we’ve the S&P’s 50-year regression channel as plotted from 1973 up to COVID (the red vertical line) from which the channel’s trend is extended-to-date, suggesting the S&P “ought” today be at best sub-3000 rather than the current 4719:
 By the numbers indeed, the most daunting being lack of price-supportive earnings — and far worse — the lack of money when it all goes wrong.The good news is: irrespective of the S&P’s ominous (understatement) overvaluation, the market is never wrong. The bad news is: the market always reverts to its broadest measures of mean. And should your use your trusty Pickett slide rule to do such reversion math, an S&P “correction” of -50% wouldn’t be untoward a wit. We merely await the FinMedia coming up with the catalyst, of which there are a multitude from which to choose, (see our 09 July missive that cited “Stocks’ 10 Crash Catalysts”), or to quote Bill Cowper from away back in 1785: “Variety is the spice of life”. And our sense remains “Look Ma! No Money!” shall be the ultimate crash driver. The Federal Reserve can then double the money supply to cover what the investment banks cannot credit to you after having sold your stock, the price of Gold at least doubles beyond where it already “ought” be (see the opening Gold Scoreboard), and on we go.And thus to Gold let’s Go! In settling this past week at 2034, Gold is -118 points below its 04 December All-Time High of 2152. Regardless, price just completed its fourth up week of the last five, such fruition from the foresight to be “in” rather than face being fried upon stocks’ suicide. Here we’ve Gold’s weekly bars from one year ago-to-date, the current parabolic Long trend now nine weeks in duration. But don’t worry, should you deem that as too long: the longest such Long trend this century lasted 26 weeks back in 2005, which was preceded by a like 25-week stint in 2004 and later by a 24-week run in 2019. In fact from the year 2001-to-date, Gold has recorded eight parabolic Long trends of 20 or more weeks. Which is why we say: “When Gold goes, it Goes!” To the graphic with Sly we go:
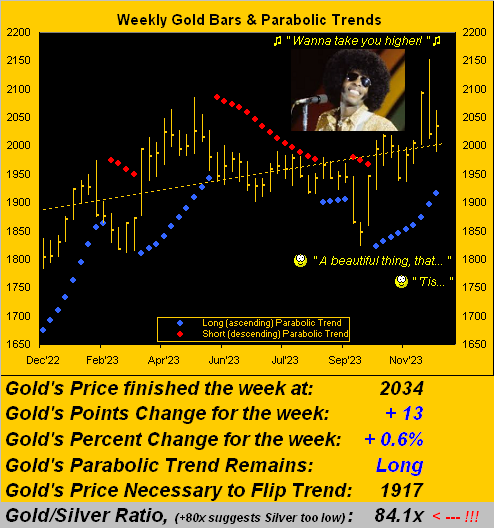 But wait, there’s more: for can the Economic Barometer also go higher? Hat-tip Media Research Center in canvassing ABC News to discover that we’re wrong, for President Biden’s economy “is really wonderful” … even as the StateSide Treasury Deficit for November alone rocketed +26% “on higher interest costs”. Do we again cue BTO’s
  “You Ain’t Seen Nothing Yet” –[’73]? How about the month’s core retail inflation increasing from a +0.2% clip in October to now +0.3%? Fortunately favouring the Fed’s rate cut musings, the New York State Empire Index faceplanted from November’s +9.1 reading to -14.5 for December: “Smunch!” Here’s the Econ Baro representing the whole bunch:
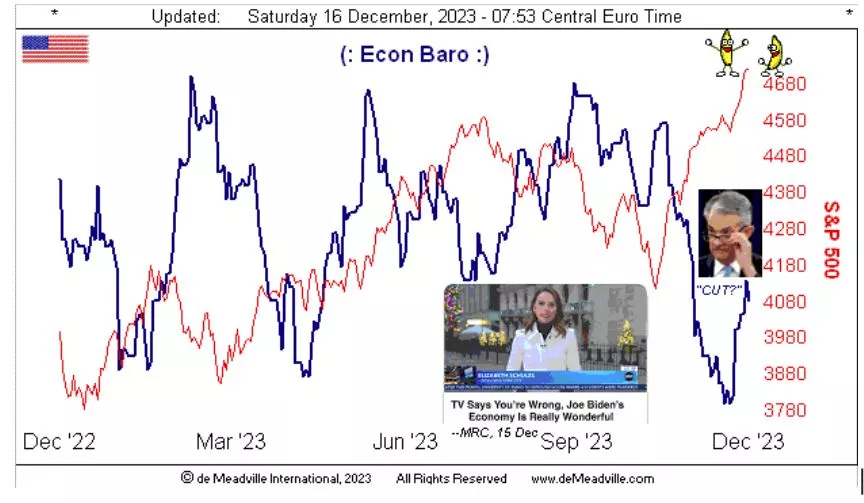 All-in-all as to when to cut its Funds rate, the Fed now awaits the go-ahead from the FinMedia, (given the recent paradigm in which they oversee the Fed). And yet, credit still is due November’s Retail Sales with a month-over-month whirl-round from -0.1% to +0.3% whilst Industrial Production similarly got going from October’s -0.6% sag to bag +0.2% for November.Meanwhile countering Gold’s post-All-Time-High price drag, both precious metals have resumed showing some swag. Below we’ve the two-panel graphic of daily bars across the past three-months-to- date for Gold on the left and for Silver on the right. To be sure, the baby blue dots of the yellow metal’s trend consistency are still slipping, but with less acceleration, whilst those for the white metal have at least paused their fall. And of course, the broader three-month trend across both panels is obviously up:
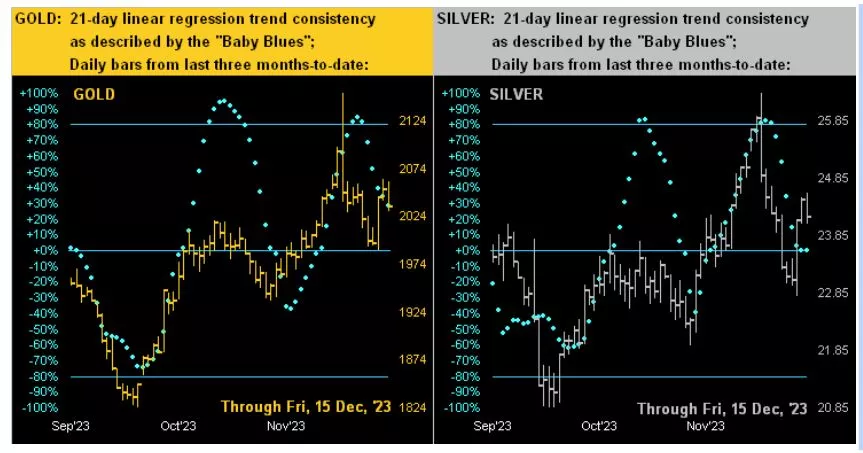 Then too we’ve the 10-day Market Profiles for Gold (below left) and for Silver (below right). Despite Gold’s 164-point trading range these last two weeks, clearly the home of trading volume price consensus is right there at 2047. And in Silver’s case, same is her 24.15-24.45 zone:
 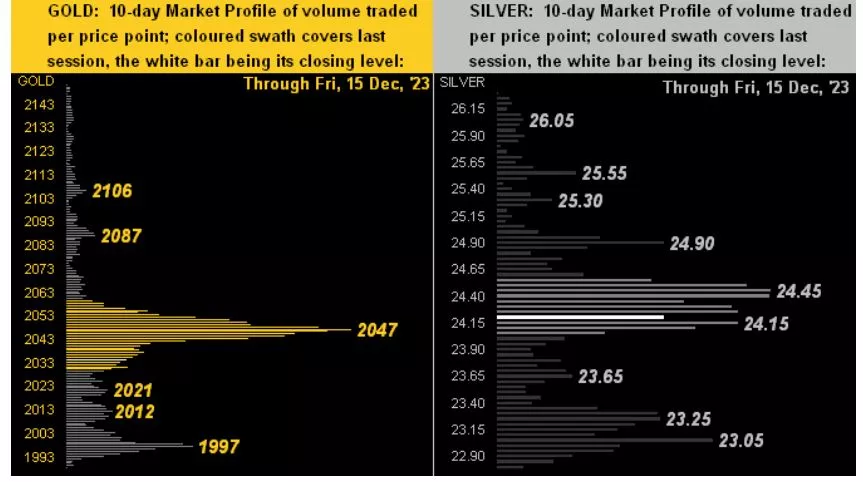 Time we go to wrap with:The Gold Stack
Gold’s Value per Dollar Debasement, (from our opening “Scoreboard”): 3704
Gold’s All-Time Intra-Day High: 2152 (04 December 2023)
2023’s High: 2152 (04 December)
Gold’s All-Time Closing High: 2092 (01 December 2023)
The 2000’s Triple-Top: 2089 (07 Aug ’20); 2079 (08 Mar ’22); 2085 (04 May ’23)
Trading Resistance: 2047 / 2087 / 2016
10-Session “volume-weighted” average price magnet: 2042
Gold Currently: 2034, (expected daily trading range [“EDTR”]: 33 points)
Trading Support: 2021 / 2012 / 1997
10-Session directional range: down to 1988 (from 2152) = -164 points or -7.6%
The Weekly Parabolic Price to flip Short: 1917
The 300-Day Moving Average: 1909 and rising
The Gateway to 2000: 1900+
2023’s Low: 1811 (28 February)
The Final Frontier: 1800-1900
The Northern Front: 1800-1750
On Maneuvers: 1750-1579
The Floor: 1579-1466
Le Sous-sol: Sub-1466
The Support Shelf: 1454-1434
Base Camp: 1377
The 1360s Double-Top: 1369 in Apr ’18 preceded by 1362 in Sep ’17
Neverland: The Whiny 1290s
The Box: 1280-1240And please do not fall afoul of the following … ’tis coming:
 Go with your Gold!Cheers!…m… More By This Author:Gold-Record’s Calamity; Stocks’ Stark Misfortune-To-Be Gold: Finally!Basking Under Gold


Leave A Comment