
Fundamental Forecast for USOIL: Bullish
Who is bold enough to be short oil in the aftermath of the Saudi corruption purge that surfaced last weekend? That is a question with an answer that appears to come up with few names. Despite ending last week in an overbought zone per the five-period Relative Strength Index, a technical measure of the velocity of a market’s price action.
Despite aggressive production out of the US, the price of oil has risen nearly 35% from the low seen in late June, and many feel that the development is justified. While production is higher, there continues to be a decline of active rigs in the US helping to bolster bullish views in the long-term. Additionally, it appears that a derivative of the corruption purge could lead to a higher probability that an OPEC+ (a moniker of OPEC and strategic alliances) agreement to extend the curb of oil production will extend to the end of 2018.
A key way to see a supportive market is through the Brent Curves that show where price is expected to be at a premium compared to later months. This trend is known as backwardation and shows implied tightening in the physical market through 2018, which could support price.
Traders should caution that a penned-OPEC deal would lead to an aggressive rise in price. The market is a discounting mechanism and looking at institutional positioning, which ICE Brent Crude weekly Commitment of Traders report shows us is sitting at record levels, any disappointing news may drop prices more than the positive news would lift prices. While we could see a development of buy-the-rumor-sell-the-news, the selling is likely to stop at a higher level as the fundamentals of the trend appear strong. On the other hand, options markets are showing interest exploding with bets that payoff if Brent Crude hits $80 before year-end.
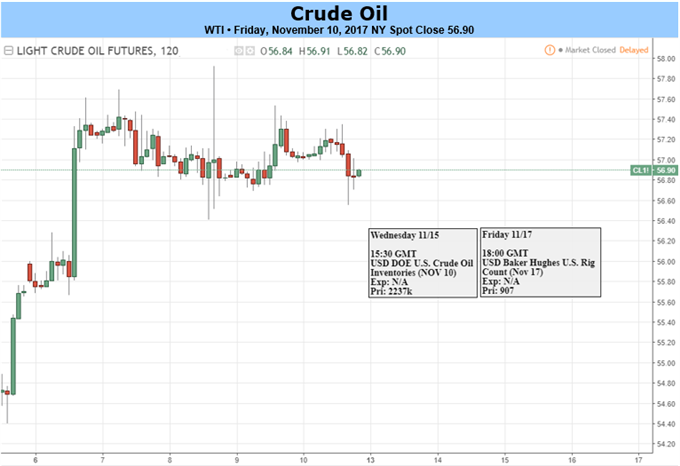
Now, on to the charts. Earlier, we mentioned the positioning that is set to take advantage of a further rise in prices. Recently, the price has struggled to break above $58, the highest level since June ’15. Beyond $57.92, this week’s high, traders should look to the 2015 high of $62.58. A breakdown of price would likely first find support at the prior 2017 high ($55.18) followed by the September high ($52.86.) A hold and reversal higher from here would turn sights back to the 1.618% extension at $59.08 where a close below $52.86 could see a test of the October low at $49.10.


Leave A Comment