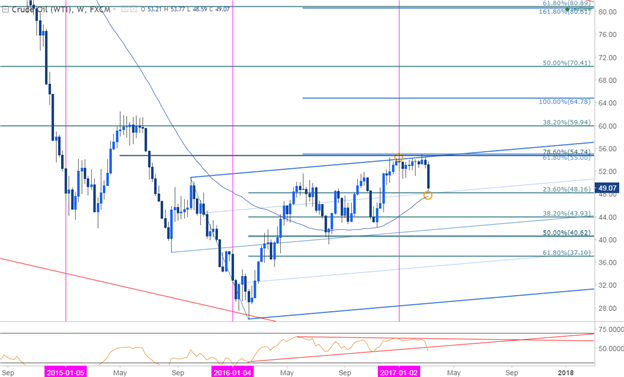
Crude Weekly

Technical Outlook: Last month we highlighted a well-defined yearly opening-range in crude with the risk weighted to the downside as prices pressed a critical long-term resistance threshold at 54.74-55. We also note that “large speculators continue to hold record long positioning since January and with the market so heavily weighted, the washout could be rather vicious.” Crude prices are down for the fifth consecutive session (-7.9% on the week) with the pullback now approaching initial support at 47.60-48.70– a level defined by numerous long & short-term Fibonacci considerations as well as 200-day & 52-week moving averages. Bottom-line, this is the level to beat to trigger the next big leg down in prices- shorts are vulnerable into this region near-term.
Crude Daily
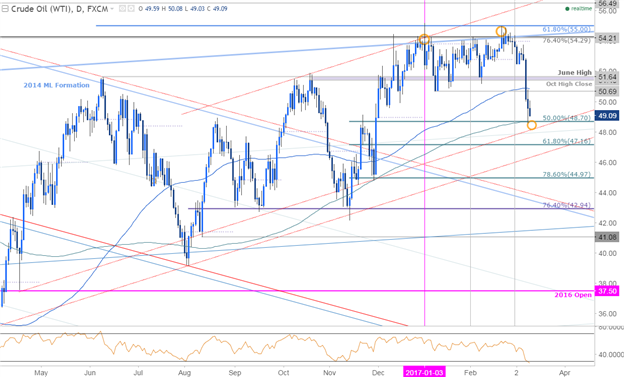
Notes: A closer look at the daily chart highlights the weekly low registering just pips off the 50% retracement of the November advance with slope support extending off the April lows coming in just lower. Look for a reaction there. Interim resistance stands at 50.69 with our focus lower sub 51.64 (bearish invalidation). A break lower targets subsequent support objectives at the 61.8% retracement at 47.16 and basic trendline support extending off the April low, currently ~46.30s.


Leave A Comment