One of the key themes from our investment strategy conference this year (see here for audio and slides) was how valuations and sentiment play into future stock market returns. Valuations and sentiment go hand in hand as valuations indicate what people are willing to pay for a dollar of earnings. During times of exuberance, investors overpay for earnings and, during times of fear, investors underpay for earnings. Consequently, monitoring sentiment can be a useful tool for investors who can keep their emotions in check.
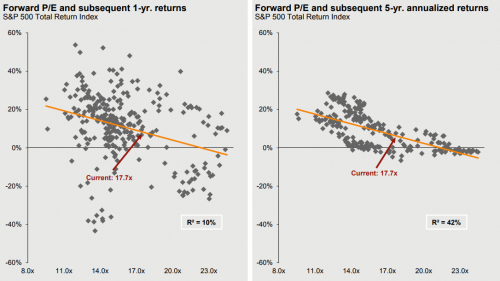
While sentiment can be a useful investment tool, often it is only useful at extremes with various measures of sentiment having different periods of usefulness. For example, stock valuations at any given point have very little predictive power for near-term (1-year) forward returns in the market; however, the further you look out (5+ years), the more predictive they become. To see this visually, we show a scatter plot of historical valuations using the forward price-to-earnings (PE) ratio for the S&P 500 and its subsequent return one year out (left figure) vs. five years out (right figure).
As you can see, when looking out 1 year, the data is highly scattered with no real discernable relationship between valuations and returns. At the current forward PE of 17.7 (highlighted by the red arrow), 1-year future returns have ranged as high as 30% to a loss of nearly 20%. However, the figure on the right shows a much tighter relationship, illustrating that market valuations are much better at giving us an idea of what to expect over the long-term.

Source: JPM, Guide to the Markets (4Q 2017)
That’s nice and dandy, but what about the short term? Here, there are several measures of sentiment that we can use and, when they hit extremes, it pays to heed their message. Currently, two measures of sentiment are sending cautionary signals that 2018 may not be as strong of a year. One such measure is the widely followed ISM Manufacturing PMI, which is a sentiment measure for manufacturing and has historically shown a close relationship with the year-over-year (YOY) rate of change with the S&P 500. This relationship is shown below with the S&P 500’s annual appreciation in black and the ISM Manufacturing PMI in red.


Leave A Comment