I’m sharing some world major indices chart. Please have a look …
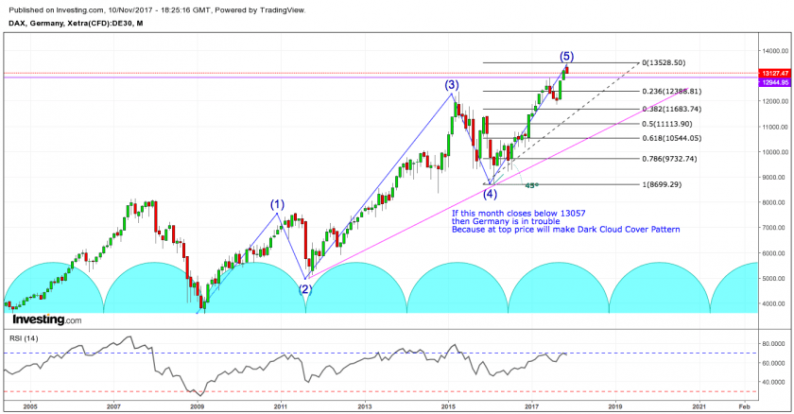
DAX Monthly Chart –

Keep a close watch on DAX… This month closing is very important !! Close below 13052 level will be negative.
DAX Weekly Chart –

Weekly also suggesting Sell now. Has made Bearish Engulfing Candle and also has negative divergence! Watchful !
FTSE 100 Monthly Chart –

FTSE Monthly Chart Closing is on the radar !
FTSE 100 Weekly Chart –

Weekly Chart is Interesting – Double Top… Price rejected from the last High. Negative Diversion is there. Keep an eye!
CAC 40 Monthly Chart –

CAC 40 Monthly Chart on Radar. Next 2 Months Imp.
CAC 40 Weekly Chart –

CAC Weekly Chart is clearly showing negative diversion with Price rejected the last High. At imp resistance level, Price has made Evening Star Candlestick Pattern. Next Week is imp.
So overall Europe Major indices are in Trouble!! So next 2 Months will give an idea of where they will be heading.


Leave A Comment