“Davidson” submits:
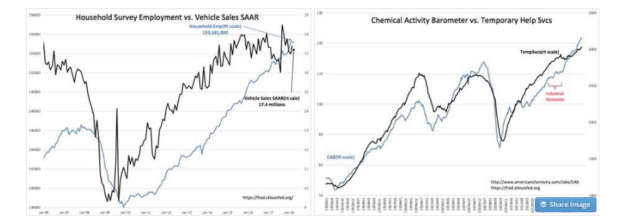
The media and most advisors take every monthly economic release as ‘do-or-die’. Lost in the rush to trade on the most recent information are the routine adjustments to economic reports in later months which make initial interpretations meaningless. Today’s employment numbers were deemed ‘weak’, but as the chart of the Household Survey Employment shows, the employment trend remains intact from 2009. Vehicle sales are holding in the 17mil-18mil SAAR (Seasonally Adjusted Annual Rate) range which reflects steady demand as employment levels expand. Even though employment is not as accurate an economic guide as other indicators, it still rolls over well before economic/market tops and provides a useful signal for economic/market tops up to 12mos early. There is no sign that a market top is at hand in the employment data. Note that Temporary Help Svcs and the Chemical Activity Barometer which are better leading indicators remain in strong uptrends.

We hear every week, “The trend is your friend.” The market’s price trends are often spoken of as predicting economic trends. Market prices are accepted by many as efficient reflections of ‘value’. For those who study economics and individual business activity, the reality is quite different. Economic and individual business activity is the basis of investor perception which then becomes reflected in market prices. The diagram stylizes how human activity in seeking to improve one’s standard of living works its way into economic/business fundamentals and eventually emerges as perceptions of future value. Market prices are simply what the majority of investors believe something will be worth at some point in the future. Market prices at any point in time reflect hope/expectation, not current value.
Market prices are perceptions, expectations of returns which have not yet been generated. That every prominent investor has differing views makes it that much more confusing as to what is the right view. There is no right view. Investing is an individual-centered-process making guesses based on the particular factors they monitor as to how and specifically where market psychology is likely to shift. Investing is the art of shifting capital into positions which will benefit from shifts in market psychology before they occur. The diagram shows how human activity(economics/self-governance policies) evolve through the economic data, become part of general media awareness, shapes market psychology and finally enters market prices. Human activity comes first, market prices based on perceptions come last.
Investing is the art of shifting capital into positions which will benefit from shifts in market psychology before they occur.
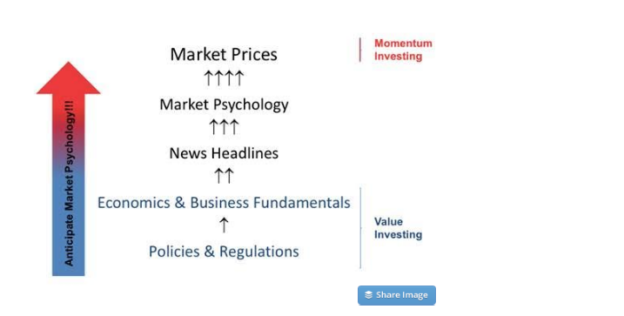
In the diagram Momentum Investing is adjacent to Market Prices with Value Investing adjacent to Economics&Fundamentals/Policies&Regulations. Investing perception ranges widely from Value Investors who focus on historical comparisons between prices and fundamentals and Momentum Investors who rely mostly on price trends on the belief that prices efficiently reflect fundamentals. There is no sharp demarcation between these two ends of the spectrum. Prominent investors/advisors featured in the media have every investment position imaginable which makes seeking advice by the average investor very confusing and impossible. Making investing even more confusing is that at major market lows, Value Investors have the greatest influence on pricing lows while at market tops, it is Momentum Investors chasing prices who dominate pricing. Recession lows occur through the buying of Value Investors finding long-term value opportunities and market tops occur through Momentum Investors chasing short-term returns. Market psychology evolves across every cycle from Value Investor perceptions at economic/market lows to Momentum Investor perceptions at economic/market peaks. The diagram identifies the complexity present in the investment process which requires careful and consistent navigation by investors seeking to take advantage of the complete economic/investment cycle. The media tends to focus on Momentum Investors as it is this group which rapidly shifts perceptions with every shift in prices as a daily input.
Investors who recognize that fundamentals are the eventual driver behind market prices are called Value Investors. They work to understand the value proposition in business assets and then buy securities at levels which they believe are discounted to future expectations. They are anticipating shifts in market psychology by anticipating changes in underlying business fundamentals. Those who believe market prices reflect economic and business fundamentals efficiently are called Momentum Investors. Every ebb and flow of market activity becomes a reason for Momentum Investors to adjust their perspectives. Featuring shifts in Momentum Investor opinion is good for stimulating advertising revenue even though true shifts in economic trends take several years to be apparent. Value Investors comprise a very small portion of media attention. The stress on short-term shifts in market prices and accompanying commentary leads most investors to believe they should be traders in my opinion. Investors also chase those issues with the greatest positive coverage which drives them to prices well in excess of fundamentals.
The better investors are sensitive to Value Investing at market lows and recognize the impact of Momentum Investing at market highs. Their perspective transitions from Value to Momentum as the market cycle progresses. Some Value oriented investors will even buy into Momentum favorites if they can justify higher markets based on economic trends. The current cycle even has its own acronym for highly over-valued issues, i.e. FANG stocks. Tesla (TSLA) is considered one of these where investors are infatuated with its future and Elon Musk. In spite of serially having no earnings, negative cash flows, missed production forecasts and a highly questionable acquisition, TSLA remains a market favorite. Even recent concerns about its precarious finances seems to have had little effect on investor enthusiasm. Such is Momentum Investing.
Tesla Feels the Weight of Solar Panels
There are many who believe that as goes TSLAso does the US economy and the equity markets. These are Momentum Investors. Value Investors speak of TSLA as grossly over-priced vs. its business and industry fundamentals. How groups of seemingly intelligent individuals come to believe in a theme without factual evidence was Eric Hoffer’s focus in his “The True Believer”, 1951. Every serious investor should read Hoffer’s book. He explains clearly how groups come believe in the value of things even against factual evidence. TSLA is the modern equivalent of the 1636-37 ‘Tulip Mania’ in my opinion.
The media message today is that the recent nervous bout of market volatility is ‘telling us’ that market top is near. Market prices have ebbed since February. There are calls for recession even as employment levels continue to rise. US and global economic trends are continue to expand. We have only recently exited the industrial recession of 2014-2016. The recently enacted tax reductions and the dramatic regulation reductions of 2017’s have yet to be felt economically. Policy changes like these impact economic trends slowly over years. Predicting economic trends using equity market prices as a basis of analysis is nonsense.
Several key employment and other economic indicators forecast continued economic expansion. Most of these are lost in the media’s daily machinations with only occasional mention. An indicator never mentioned is the T-Bill/10yr Treasury Rate Spread. Mostly we hear discussion of the 2yr/10yr Treasury Rate Spread or the 5yr/10yr Treasury Rate Spread. I am confused as to why there is a focus on these when the T-Bill/10yr Treasury Rate Spread, which is the best proxy of bank lending to the home mortgage market. This spread can also be thought of as a measure of market psychology. During market panics, investors sell equities and other higher risk investments to buy T-Bills which drives these rates lower. The recession rate spread to the 10yr Treasury widens to more than 2%(200bps-basis points). In the charts, the 2% level is marked with a GREEN DASHED LINE. As investor confidence gradually returns, investors sell T-Bills causing T-Bill rates to rise believing higher returns lie elsewhere. The rate spread with the 10yr Treas narrows. The cycling of the T-Bill/10yr Treasury Rate Spread impacts bank lending profits. The spread is widest during recessions which makes it more enticing for banks to lend. When investors drive this rate spread lower by chasing anticipated returns elsewhere, it narrows to a level which virtually shuts down bank lending and throws the economy into recession. Lending shuts down when the spread falls to 0.2% or less and is marked with a RED DASHED LINE. As much of the capital shift out of T-Bills goes to equities, it creates what is called a ‘speculative top’ in the equity markets. The history of this indicator from 1953-Present is very good as shown in the chart vs. SP500 and Recession Periods.
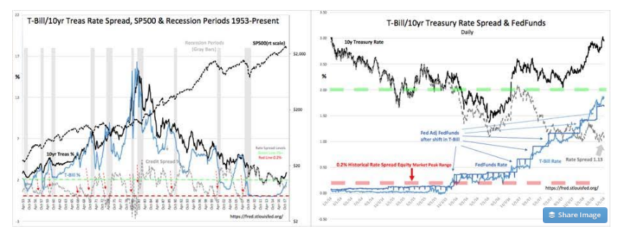
Recent levels of the T-Bill/10yr Treasury Rate Spread are mid-range between the 0.2%-2% range which characterizes the investment cycle. This is shown in the 2014-2018 chart. Any concerns investors may have due to market volatility is misplaced in my opinion. As long as the T-Bill/10yr Treasury Rate Spread remains above 0.2%, history indicates that bank lending and economic activity continue to expand. As long as lending continues, economic news remains positive and equity prices rise.
Another figment of investor imagination which is universal is the belief that the Fed controls rates. The evidence is heavily against this perception. As the 2014-2018 chart shows, the Fed has been following T-Bill rates after market rates have shifted. One can examine the historical data to 1953 and the pattern remains that the Fed follows, it does not lead but for Chairman Volcker’s raising rates to quash inflation in the early 1980’s. How the belief that ‘the Fed controls rates’ has become entrenched in our investment perception is a puzzle. The Fed’s history is that it typically follows-it does not lead. The Fed does not control our economy. Investor psychology controls the pace of economic activity through the impact on T-Bill rates.
The Investment Thesis:
Market volatility and equity price trends do not signify economic changes. It is economic activity which emerges as news headlines, which in turn drives market psychology and this in turn drives market prices. T-Bill rates relative to 10yr Treasury rates serve as a proxy for bank lending and the pace of economic activity. The T-Bill/10yr Treasury Rate Spread at 1.13% is mid-range relative to its ~70yr history. It continues to forecast additional economic expansion. Higher equity prices are likely.


Leave A Comment