One of the great mysteries surrounding the US economy is the seemingly inexplicable discrepancy between the plunging unemployment rate on one hand, which at 5.1% in August was the lowest since April of 2008 – a data point which on the surface would suggest virtually no slack in the labor force – and the crawling pace of growth of the broader economy, on the other hand, namely the deterioration in US output and labor productivity, and the constant failure of wages to actually grow despite constant predictions by economists and pundits over the past 5 years that “wage growth is just around the corner.”
This relationship has had a name since 1962 when Arthur Melvin Okun first observed the empirical relationship between unemployment and losses in a country’s production. It is called Okun’s law.
In theory, the original statement of Okun’s law said that a 2% increase in output corresponds to a 1% decline in the rate of cyclical unemployment; a .5% increase in labor force participation; a .5% increase in hours worked per employee; and a 1% increase in output per hours worked (labor productivity). Okun’s law states that a one point increase in the cyclical unemployment rate is associated with two percentage points of negative growth in real GDP. The relationship varies depending on the country and time period under consideration.
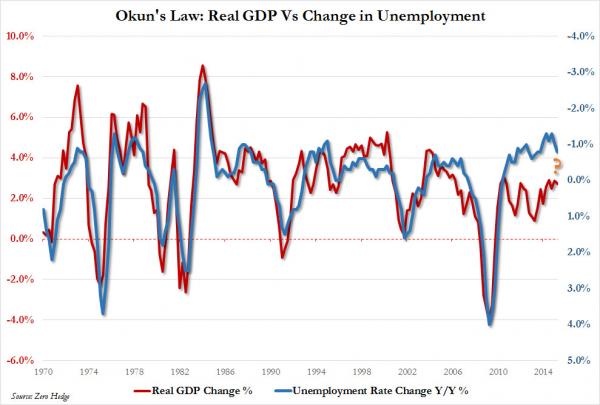
As the chart below shows, the “Okun Law” relationship has been one of the empirically observed mainstays of the US economy, with the real GDP growth rate constantly superimposed on top of the inverted unemployment rate…until 2010 when something snapped.

To be sure, both we and others have commented on the unprecedented discrepancy between the “strong” economy dictated by the unemployment rate, and the “weaker” economy signaled by virtually every other indicator, certainly the annual growth rate of US GDP, which in Q3 rose 2.7% from a year ago.


Leave A Comment