
The Death Cross, whereby the 50-moving average crosses under a moving average of 100 or 200, occurred recently in a weekly time frame for the S&P 500. The subject has raised some concerns amongst investors as financial media pundits emphasized that it has occurred only twice in the previous 16 years. One occasion marked the onset of the Great Tech Wreck in 2001 and the other ushered in the Great 2008 Recession. The inference is that because both preceded some of the worst carnage of capital destruction experienced in investment history, the reemergence of this pattern indicates a high probability or almost guarantee that another bear market is imminent.

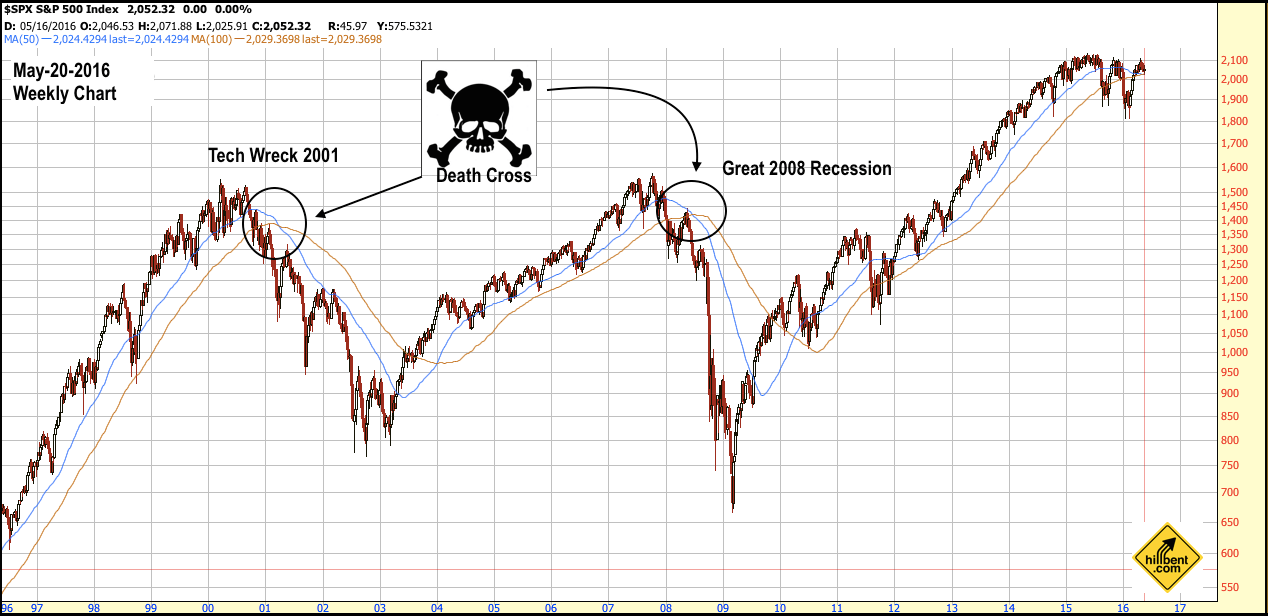
However, the reality is that these last two financial crashes were so severe that their ghosts continue to haunt the market. Completely ignoring this indicator is not wise, but neither is believing Chicken Little financial media pundits frantically running around and screaming “the sky is falling “. Before dismantling the myth of the Death Cross and reconstructing it within a proper context, let me state, as a proponent of technical analysis, that even I raise an eyebrow when I see this crossover. Now, in true Hillbent fashion, shall we begin?


Leave A Comment