After a few years of relative fiscal sanity, the bond market is beginning to feel the effects of a turning tide. During the summer, I wrote a blog post summarizing how the U.S. government’s borrowing need was about to get ramped up in a rather visible fashion to begin fiscal year (FY) 2018. Well, recent events (the tax cut and the budget deal) will only add to the baseline shortfall already in place, as investors will be witnessing rising debt and deficit forecasts not only this year but in the years ahead as well.
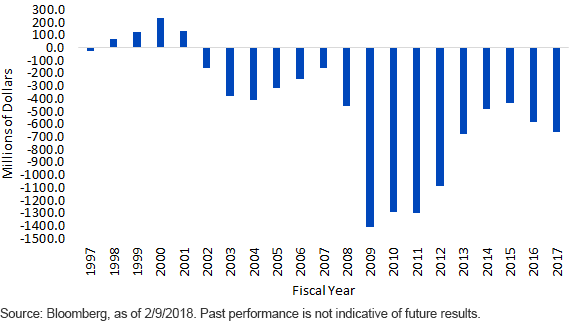
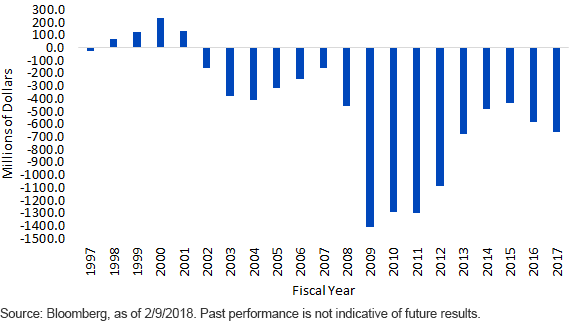
In order to digest what lies ahead, let’s get some perspective. The chart below reveals how the U.S. budget setting has evolved over the past 20 years. In fact, for those of us who are old enough to remember, from FY 1998 through 2001 the federal government actually registered surpluses four years in a row. Following that period, deficits once again became the norm and reached a crescendo in the wake of the financial crisis and Great Recession (FY 2009–2012) when trillion-dollar deficits were regularly being printed. After recording a red ink total of $1.087 trillion in FY 2012, the budget deficit dropped precipitously, reaching $438.5 billion in FY 2015, or almost a trillion dollars below the high watermark of FY 2009.
U.S. Budget Deficit/Surplus

So, where are we now? The deficit has risen two years in a row and came in at $665.8 billion for FY 2017. This ascending trajectory is expected to not only continue but increase significantly over the next few years, with trillion-dollar red ink returning perhaps as soon as this year.
Needless to say, Treasury borrowing needs are set to soar as a result. Estimates for FY 2018 place net new supply in the $1.0–$1.5 trillion range, as compared to “only” $519 billion for all of FY 2017. The nation’s debt managers got up to speed by recently announcing increases in the amount of coupon and floating rate note (FRN) auction sizes beginning this month. This should result in an additional $42 billion of net new supply for the upcoming quarter. These increases should also help Treasury maintain the current weighted-average maturity (WAM) of debt outstanding at around 70 months. For the record, the WAM was as low as 50 months back in 2009.


Leave A Comment