The data this month showed good income growth (at market expectations) – and spending growth weak (below market expectations).

The market looks at current values (not real inflation adjusted) and was expecting (from Bloomberg):.
| |
Consensus Range |
Consensus |
Actual |
| Personal Income – M/M change |
0.0 % to 0.5 % |
0.3 % |
+0.3% |
| Consumer Spending – M/M change |
0.0 % to 0.5 % |
0.1 % |
+0.0% |
| PCE Price Index — M/M change |
-0.1 % to 0.1 % |
0.0 % |
-0.1% |
| Core PCE price index – M/M change |
0.1 % to 0.2 % |
0.1 % |
+0.0% |
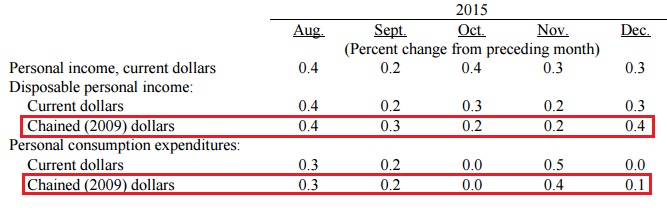
The monthly fluctuations are confusing. Looking at the inflation adjusted 3 month trend rate of growth, income growth trend is up whilst expenditures is down.
Real Disposable Personal Income is up 3.1 % year-over-year (3.3 % last month), and real personal expenditures is up 2.6 % year-over-year (2.6 % last month)
this data is very noisy and as usual includes moderate backward revision (detailed below) – this month the changes were mixed.
The advance estimate of 4Q2014 GDP indicated the economy was expanding at 0.7 % (quarter-over-quarter compounded). Expenditures are counted in GDP, and income is ignored as GDP measures the spending side of the economy. However, over periods of time – income and expenditure must grow at the same rate.
The savings rate continues to be low historically, but improved marginally this month.
The inflation adjusted income and consumption are “chained”, and headline GDP is inflation adjusted. This means the impact to GDP is best understood by looking at the chained numbers. Econintersect believes year-over-year trends are very revealing in understanding economic dynamics.
Per capita inflation adjusted expenditure has exceeded the pre-recession peak – but growth has been weak in 2015.
Seasonally and Inflation Adjusted Expenditure Per Capita


Leave A Comment