
Tonight I would like to update some charts we’ve been following for a very long time in regards to the deflationary spiral that really took hold in July of 2014. With the US dollar still in correction mode one would think that commodities would be going through the roof like the PM complex but that’s not the case. It appears that everything but the PM complex is starting to gather momentum to the downside.
Lets start with a few commodities index we’ve been tracking which for the most part are completing their breakouts and backtesting process. I doubt you’ll see this take on the CRB index anywhere else but Rambus Chartology. We’ve been tracking this one year bearish falling wedge once it became visible after the fourth reversal point was made. Note the breakout and backtest of the bottom rail that has formed a H&S consolidation pattern as the backtest.
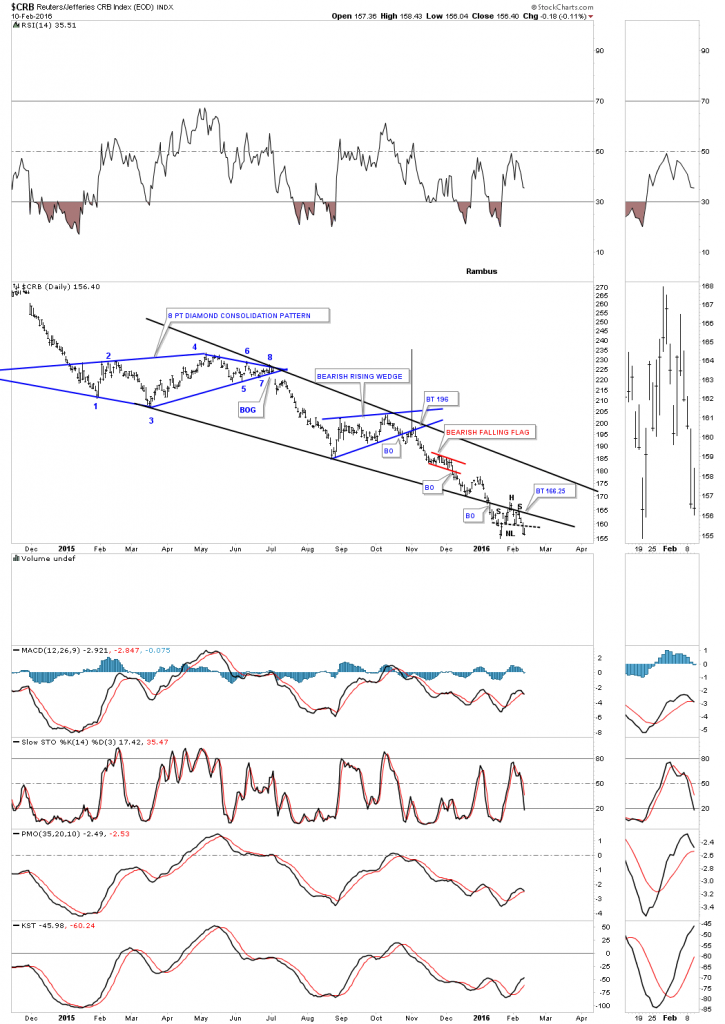
The long term daily chart for the CRB index puts the bearish falling wedge in perspective.
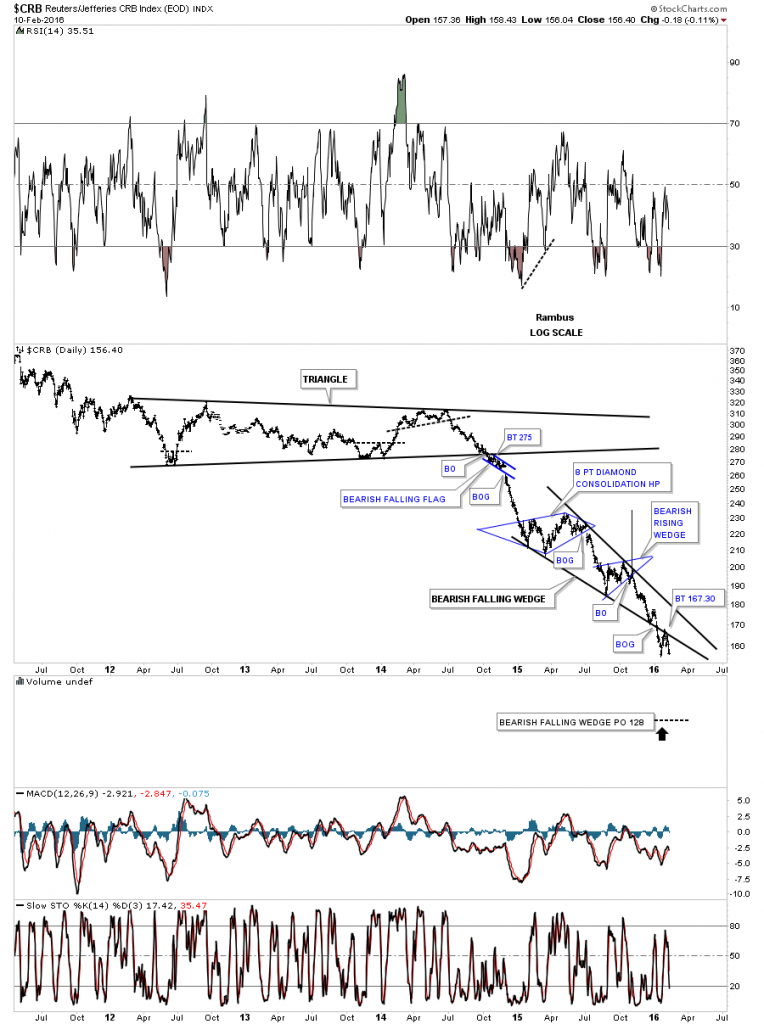
The weekly look.
![]()
The monthly candlestick chart shows another possible black candle forming just below the bottom rail of the falling wedge.
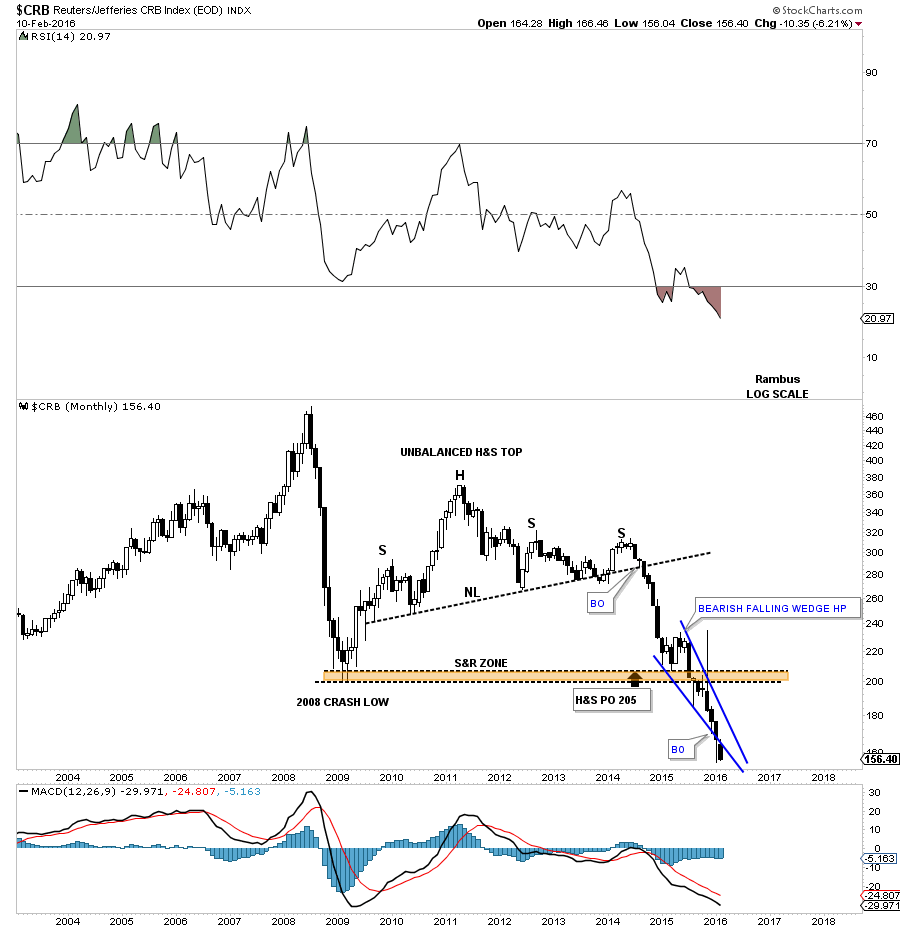
The quarterly chart goes back about 60 years or so which shows the complete history of this index. Keep in mind each bar is three months in the making. We still have roughly another month and a half to complete our current quarterly bar. The red arrows shows you how it’s reversing symmetry back down through the thin zone that was made on the way up back in the early 1970’s. I know many people didn’t believe this chart when I first posted but so far it’s playing as expected. Basically there is no support until the top of the lower brown shaded S&R zone is reached around the 110 area.

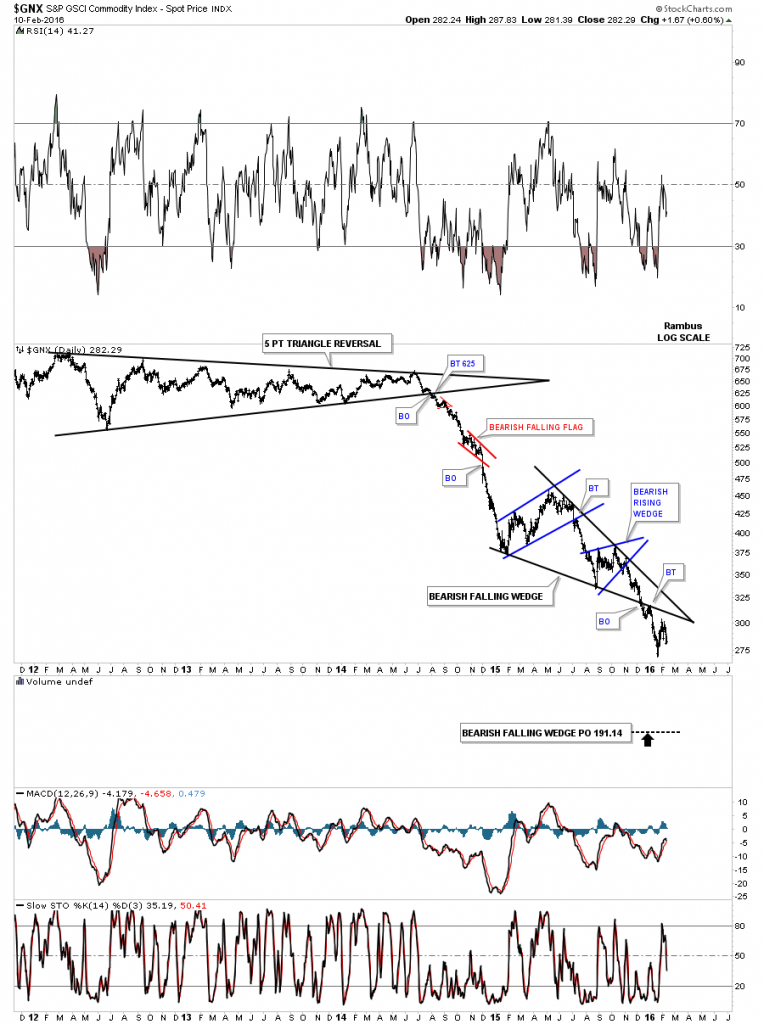
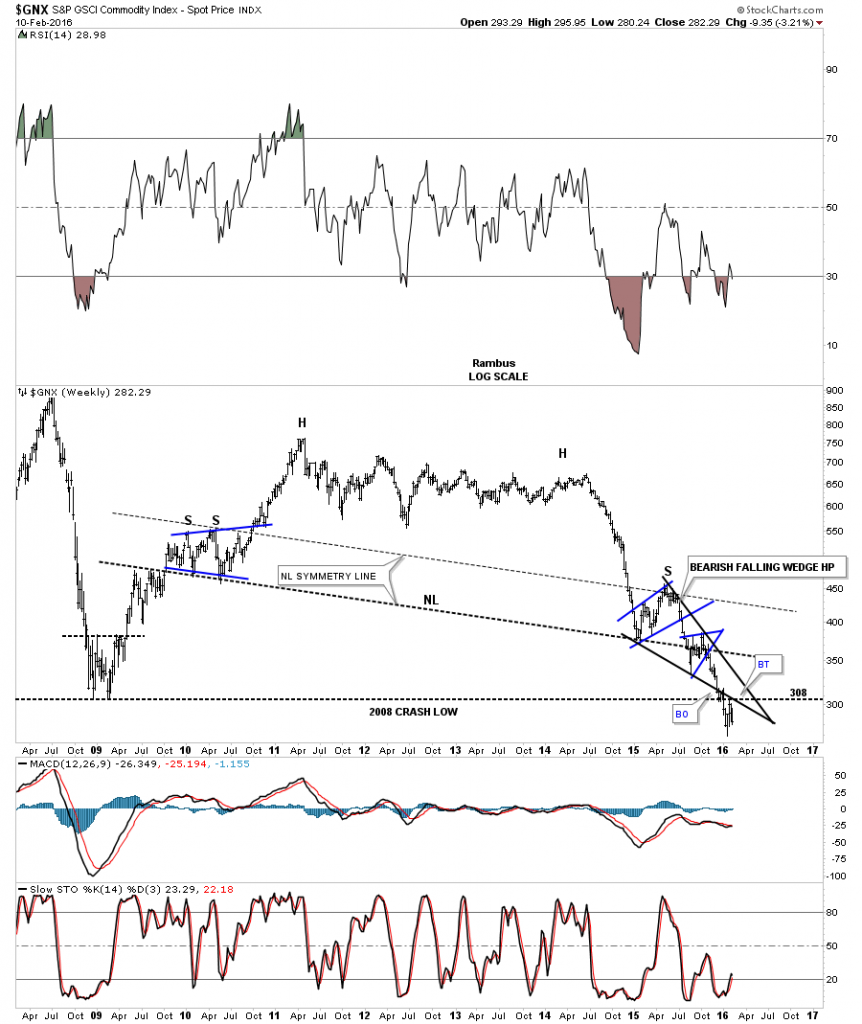
Below is another commodities index we’ve been following the $GNX which is showing a bearish falling wedge with a breakout and backtest.
$GNX weekly:
$GNX monthly:
![]()
$GNX quarterly: Now trading below the 2008 crash low.


Leave A Comment