Note: Our goal is to follow the facts, wherever they may lead. If your argument is better, let us know and we will adjust our framework. While sometimes events appear to be white or black, often the truth is in the middle, a muddied up gray, therefore rarely are their simple conclusions, or straightforward rationalizations, given that the economy is a complex system.
Many bearish investors discuss the possibility of debt causing damage to the economy. While there’s no question government debt is out of line, the private economy is a little more complicated. This is similar to how public pensions are in much more danger than private ones. Debt naturally goes up along with assets as we previously reviewed in Cost of Debt vs Cost of Equity: What’s Driving Markets?. Only looking at debt however isn’t a value added service and misses half the picture. If analysis simply shows a debt chart increasing and offers no context for the situation, it’s not really analysis.
Every action in the economy is caused by an equal and opposite reaction. For example, prior to 2008 the housing market exploded partially because banks were lending to borrowers without documents proving an income source. That was only one factor, albeit a large one, but a bigger one was low interest rates that fueled the speculation. The housing market implosion post 2008 is now being used as a reference point for another crash in the future. However, the current situation is different, as we detailed in Housing Market Leverage, therefore the consumer debt can’t be compared on an apples to apples basis. Banks have learned their lesson (mostly) and now don’t lend without more stringent safeguards.
Net Worth Versus Disposable Income Ratio
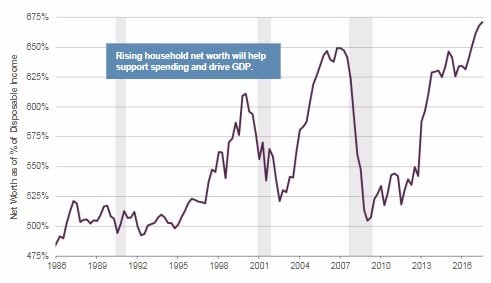
One example of positive context for the increase in consumer debt is the net worth as a percentage of disposable income seen in the chart below.

Net Worth As A Percentage Of Disposable Income
The ratio has reached the highest point in the past 30 years. This increase in net worth could help support consumer spending which drives GDP growth. Clearly this ratio is being driven by asset prices rather than savings, which are dismal as we reviewed in Delinquencies & Savings Rate: Truth In Details. When housing fell in 2007, America’s net worth plummeted. It’s interesting to see that during the past two recessions, net worth never fell to below 5 times the disposable income.


Leave A Comment