

This week, the Wall Street Journal published an article entitled “Another Black Monday May Be Around the Corner.”Fortunately, they wrote it this Sunday (22nd) and it (Black Monday) didn’t take place on Monday (23rd)! Unlike Paul Tudor Jones who called it “Black Monday” the Friday (Oct. 16th) before it actually occurred in 1987 (Oct. 19th), these two academics lack the market understanding for a repeat. They are running out of October Mondays…Here’s what the nervous Nellies are focused on: 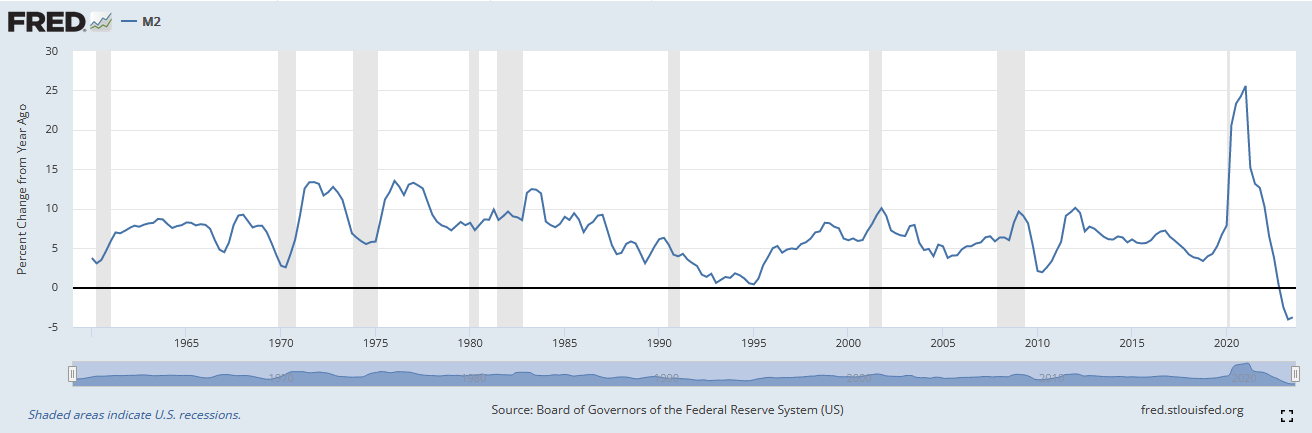

They point to the fact that because M2 Money Supply has contracted on a yoy basis, we are in “real danger.”Unfortunately this is the intellectual equivalent of focusing exclusively on the liabilities in a balance sheet and not the assets. They go on to say “Because of the sustained decline in the money supply, the economy is in real danger. So far, only the remaining excess money the Fed created between 2020 and 2021—the cumulative excess savings from the Covid handouts—has been keeping businesses hiring and consumers spending. The effects of the excess money are still giving the economy a lift, but that extra fuel is almost exhausted. When it dries up, the economy will run on fumes.”What they fail to acknowledge is there are $4 TRILLION of excess “fumes” from an unprecedented increase in Money Supply – due to an unprecedented shutdown in the global economy in 2020-2021. I drew “trend lines” so you can see just how aberrationally “above trend” we are. 

In other words, money supply will have to contract for multiple years just to come back to the long-term uptrend. This is one of the reasons we believe inflation should run above trend (in a reasonable range of 3-5%) for a few years.Like losing weight, there is an equation. The “easier” the loss (pill or needle) the greater the chance of impermanence or side effects. The “harder” the loss (healthy eating and lifestyle) the greater the chance of sustainability and improved health. We had “easy” printed money for a few years, now we are getting involuntarily taxed (through inflation) in arrears (at the checkout counter) for that benefit received. Every equation has an equal sign. If you want greater returns over the long term, you have to assume greater concentration and volatility in the short term. Anyone who tells you otherwise, run away.The key way to sit with equanimity when others are selling in the hole and running for the hills is to look at each BUSINESS you own (not stock), BUSINESS. Ask yourself the following question for each company: “If I owned this business in a private equity portfolio, is there anything that has changed about the business operations or ability to generate cashflow over the long term, that would require me to mark the value of the business DOWN in the portfolio?” If your answer was, “someone sent me a chart of 1987 and I’m scared” that is not the correct answer and you should find another hobby.Here’s what we are focused on:The 10yr yield achieved an “Outside Day” on Monday. The 2yr yield presaged this occurrence last Thursday. “An outside day is a daily price action that has a higher high and a lower low than the prior price bar. An outside day also has an open and close that both fall outside the prior open and close. When the price bars move in opposite directions, it’s called an outside reversal (Investopedia)”:


Dollar Bounce Running Out of Steam? 
High Yield Credit Spreads Still Okay: 
Seasonality Still On Point:


The Antithesis of “1987:”
Cash is Trash:

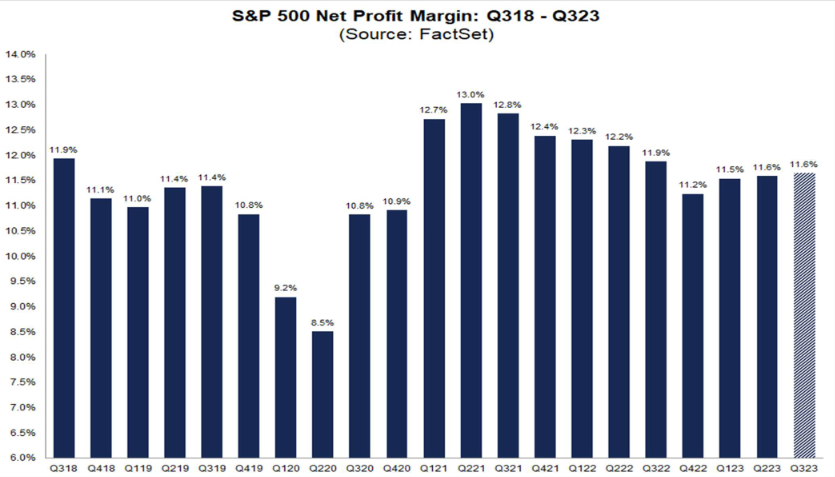
Earnings and Margins: 
Fed’s Real Target:

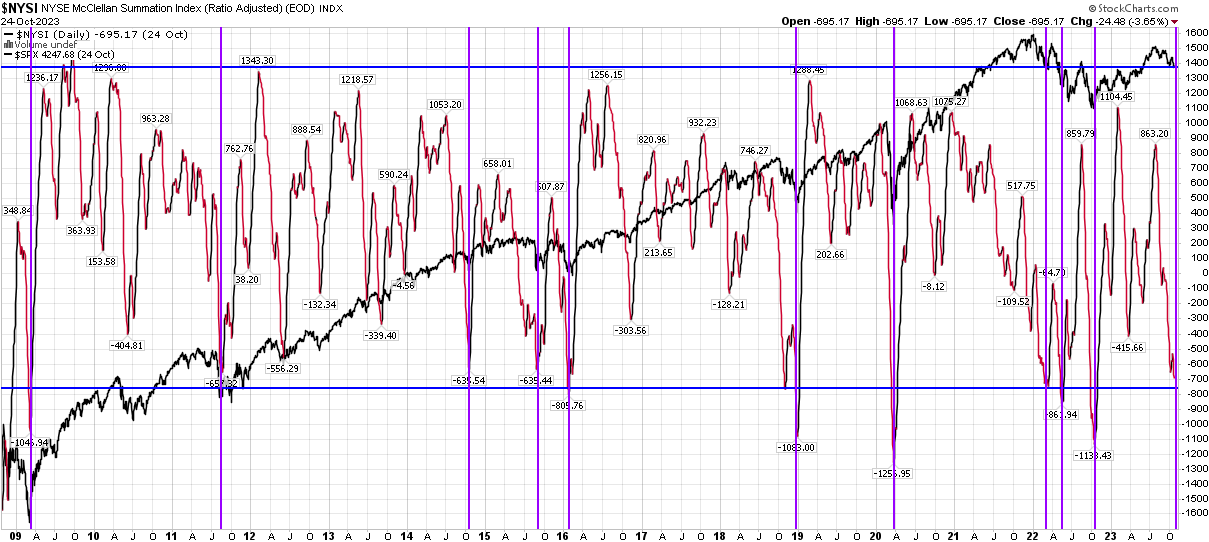
Getting Stretched (McClellan Summation): 
Massive Digestion Of 2020-2021 Gains. 0% gains in S&P for 31 months. As a general rule, markets don’t “Top” over three years, they tend to “Top” more abruptly. Markets consolidate/digest large gains over years before taking the next leg higher: 
Massive Digestion Of 2020-2021 Gains. 0% gains in Nasdaq Composite for almost 3 years: 
0% gains in Small Caps for over 5 years:
Emerging Markets continue to be ignored, just as signals point up:
China Earnings:
Economy Tracking: 
Households Strong:
Blackout Periods Ending. Buybacks to commence:
PMIs bottoming:
10-Day Moving Avg Put/Call Coming Off The Boil: 
History Rhyming? 
S&P Bullish Percent: 
Nasdaq Bullish Percent: 
Consumer Discretionary Bullish Percent: 
Consumer Staples Bullish Percent: 

Utilities Bullish Percent: 
Healthcare: 
Real Estate: 

Cooper Standard Reports on November 2:
Now onto the shorter term view for the General Market:
In this week’s AAII Sentiment Survey result, Bullish Percent (Video Explanation) dropped to 29.3 from 34.1% the previous week. Bearish Percent moved up to 43.2% from 34.6%. Retail investors are nervous.

The CNN “Fear and Greed” dropped from 35 last week to 30 this week. Investors are fearful. You can learn how this indicator is calculated and how it works here: (Video Explanation)

And finally, the NAAIM (National Association of Active Investment Managers Index) (Video Explanation) ticked up to 66.67% this week from 45.80% equity exposure last week. 
After reviewing the comprehensive data throughout this article, the only thing I can suggest is to follow Wilson Phillips’ profound advice from their 1990 hit “Hold On:”
Don’t you know?
Don’t you know things can change?
Things’ll go your way
If you hold on for one more day
Can you hold on for one more day?
Things’ll go your way
Hold on for one more day…
More By This Author:“The Only Chart That Matters” Stock Market (And Sentiment Results)…
“Let There Be Light” Stock Market (And Sentiment Results)
End Of The World? Stock Market (And Sentiment Results)


Leave A Comment