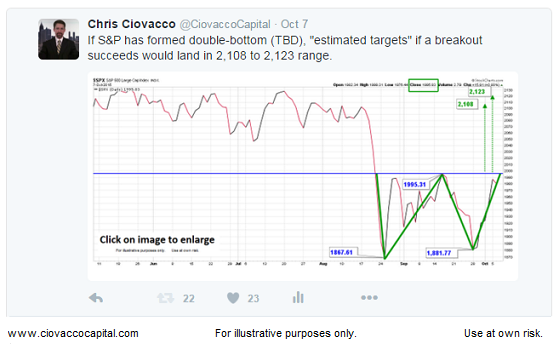
S&P 500 Before
On October 7 we tweeted the chart below, noting it was possible the market was making a double bottom (see tweet). The double bottom concept was explained in this October 9 video clip. The “targets” shown on OCT 7 were 2,108 and 2,123 on the S&P 500 Index.

S&P 500 After
The S&P 500 closed Tuesday at 2,109. The chart below is as of 3:32 pm Tuesday. As you can see, the “targets” posted on October 7 have for the most part been hit.
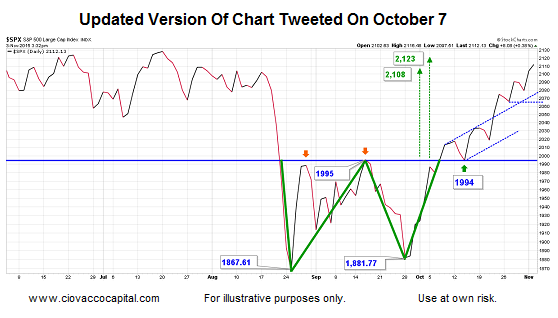
Does hitting the targets mean resistance is ahead? No, not necessarily. The market determines support and resistance rather than targets. If a reversal is in the cards, price will not miss it.


Leave A Comment