Gold snaps three-month losing streak, but LT outlook remains bearish
Gold looks set to end the three-month losing streak. The metal is seen ending January at least 4% higher. This is the last trading day of January; hence we take a look at the developments on the monthly chart.
Monthly chart
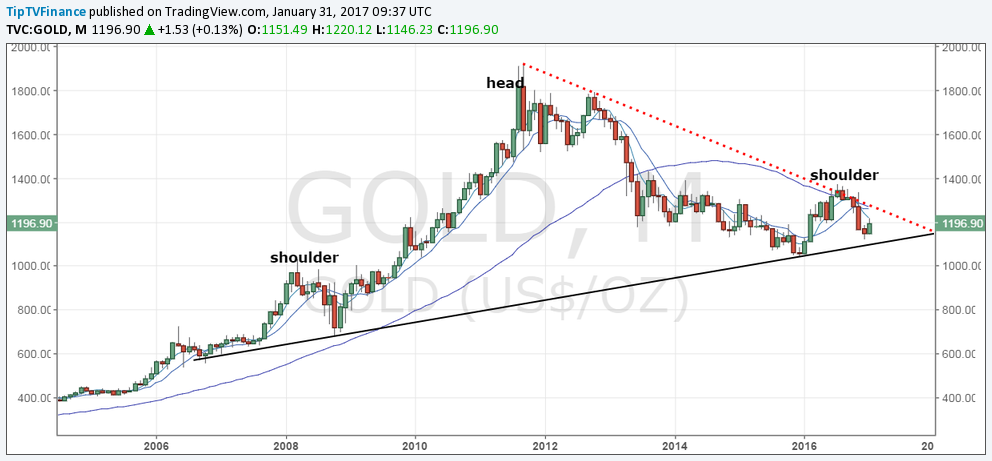
The above chart clearly shows that the rally seen this month is a corrective move of the larger downtrend.
Take note of the repeated failure seen last year at the resistance offered by the descending trend line drawn from 2011 high and 2012 high.
More importantly, gold failed to take out the key trend line hurdle despite Brexit, Trump victory.
View
The long-term (LT) view remains bearish as long as prices remain below the trend line hurdle currently seen around $1270 levels.
5-MA and 50-MA are sloping downward, which suggests any rally above $1220 and towards $1270 could be exploited by bears to hit the market with fresh offers.
On the other side, breach of support at $1146 would open up downside towards the head and shoulder neckline support seen around $1100 levels.
A monthly close below $1100 could turn out to be a disaster for the Gold bulls.
FTSE 100 – Outlook depends on today’s day end close
Daily chart
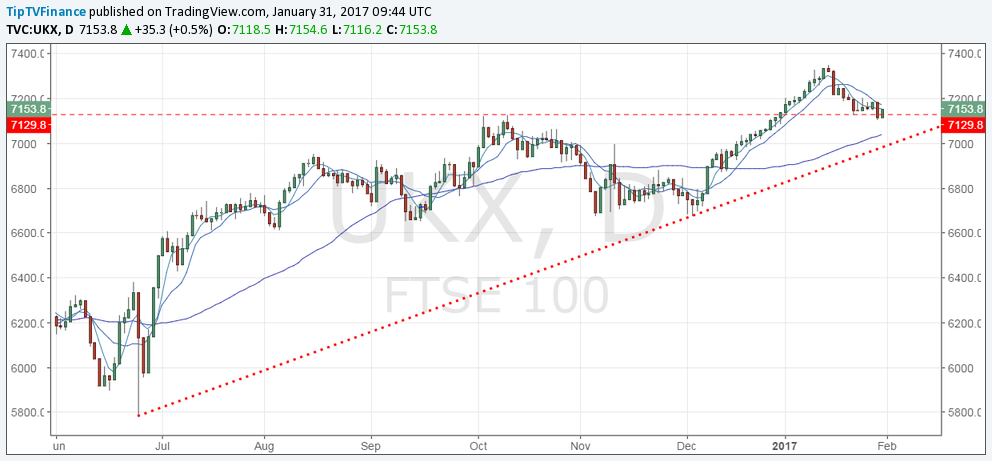
Monday’s bearish daily close below 7130 adds credence to the view that the index has topped out at 7354 and could test 50-DMA support seen around 7036 in the short-term. The rising trend line support comes around 7000 levels.
The 10-DMA level of 7175 could offer resistance today.
Only a daily close above 7206 (Jan 25 high) would signal the correction from the recent high of 7354 has ended.


Leave A Comment