
A few years ago, we developed the hedged portfolio method of investing. The basic idea was to find securities that had high expected returns over the next six months and were also relatively cheap to hedge and then to buy and hedge a handful of those names every six months.
We backtested the approach a couple of years ago and wrote it about it on another site at the time. Since June, we’ve been creating a few portfolios each week. Here we show the performance of the ones we created on June 8th.
Portfolio 1
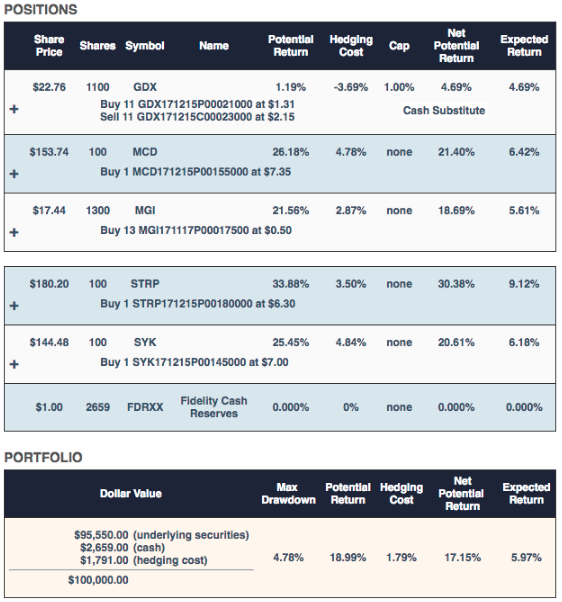
The worst case scenario for this portfolio was a decline of 4.78% (the “Max Drawdown”), and the best case scenario was a gain of 17.15% (the “Net Potential Return”, or aggregate potential return net of hedging cost). The “Expected Return” was a ballpark estimate taking into account that actual returns, historically, have averaged 0.3x Portfolio Armor’s potential return estimates.
To be conservative, the hedges in this portfolio and the rest assume you buy the puts at the ask and sell the calls at the bid.
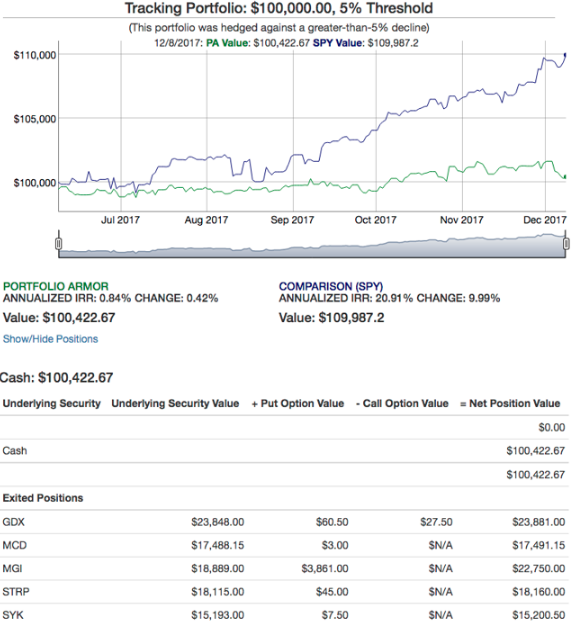
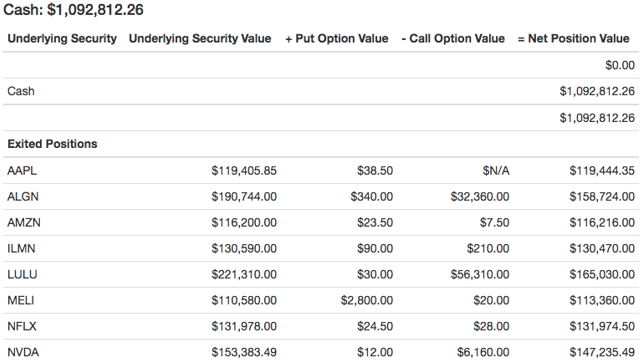
Here’s how it actually performed, net of hedging and trading costs:
Portfolio 2
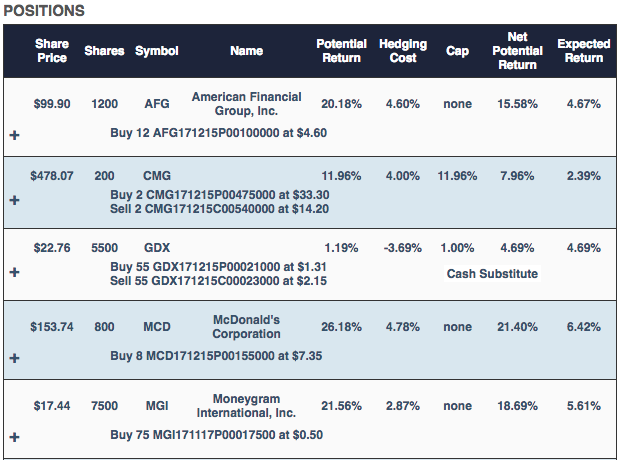
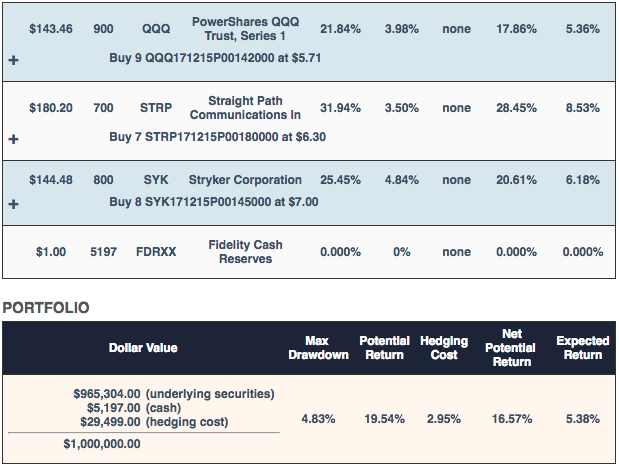
The worst case scenario for this one was a decline of 4.83%; the best case scenario was a gain of 16.57%; and the ballpark estimate of an expected return was 5.38%.
Here’s how the portfolio performed net of hedging and trading costs, and assuming the hedges were opened at the worst ends of their respective spreads.
Portfolio 3
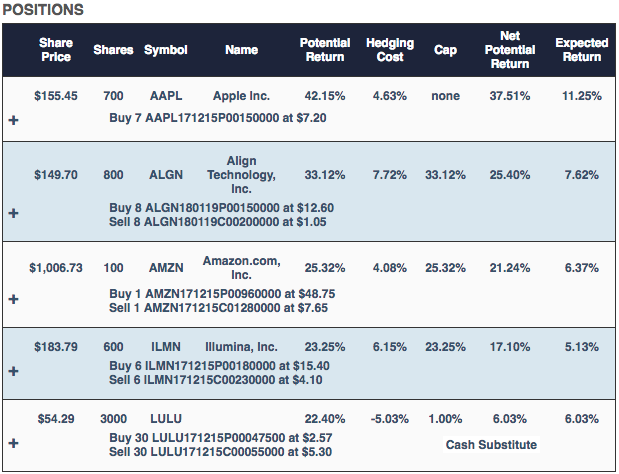
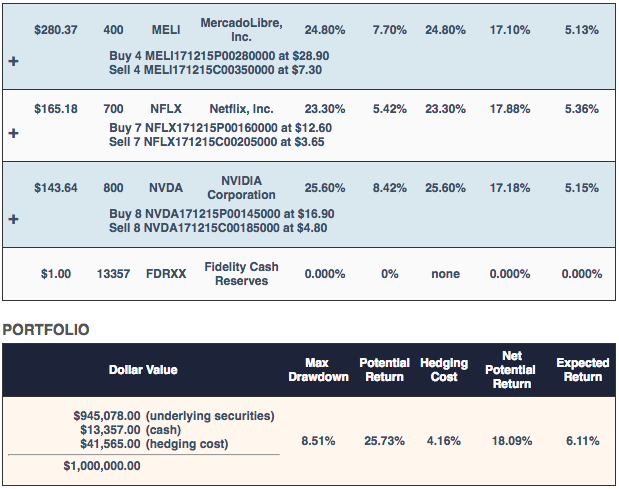
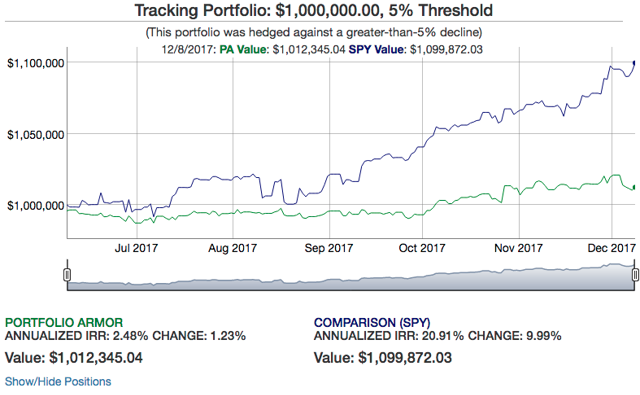
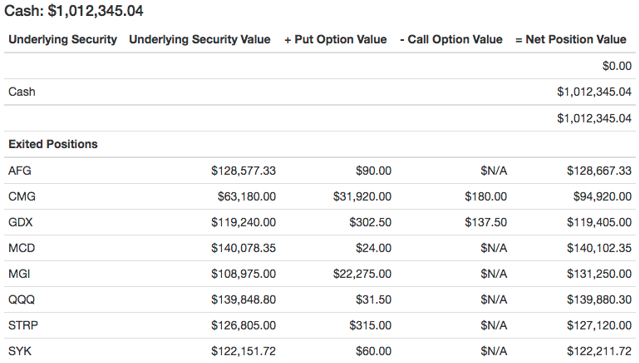
The worst case scenario for this portfolio was a decline of 8.51%; the best case scenario was a gain of 18.09%, and the ballpark estimate of expected return was 6.11%.
Here’s how this portfolio did, net of hedging and trading costs, and assuming you placed the hedging trades at the worst ends of their respective spreads.
Portfolio 4
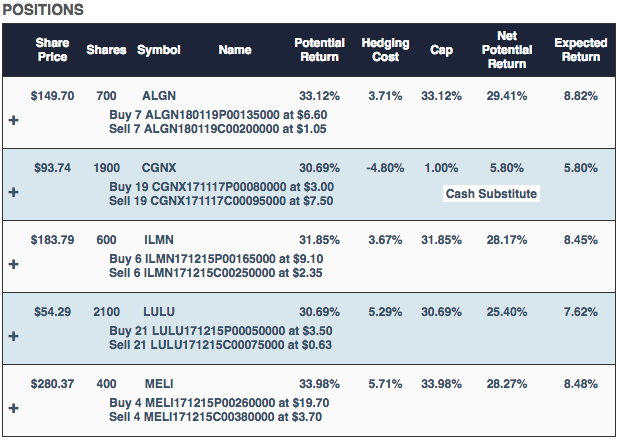
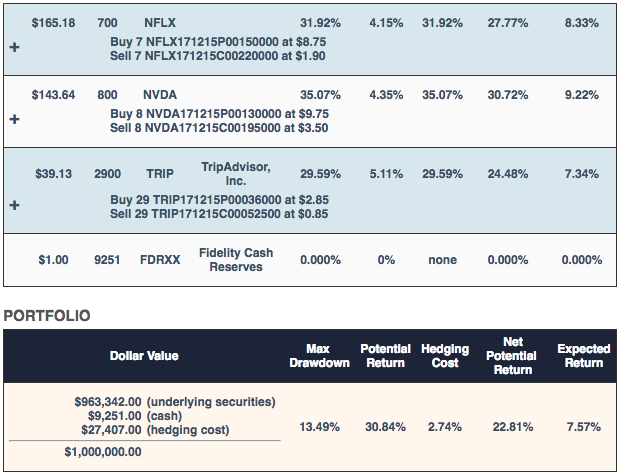
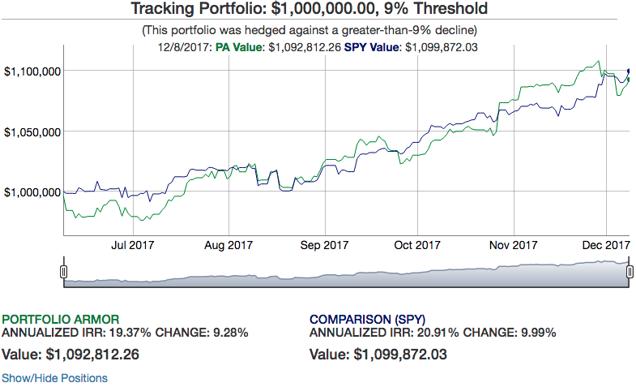
The worst case scenario here was a decline of 13.49% (the “Max Drawdown”), the best case scenario was a gain of 22.81% (the “Net Potential Return”), and our site’s ballpark estimate of an Expected Return was 7.57%.


Leave A Comment