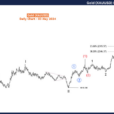
I use technical analysis in my investment decisions, and the chart that gets me most excited is the inverted head and shoulders, which analysts often describe as a head and shoulders bottom, a topic I mentioned in an earlier column.

The graphic illustrates just such a pattern. As you can see in the circles I’ve drawn, last summer the price of West Texas Intermediate oil fell to a trough and then rose. It then fell well below the former trough before rising again, forming a head. The price then fell again, but not so much.
In practice, this prefigures a sustained rise in the stock’s or commodity’s chart, and that’s where I’m putting my money – some of it, anyway. Oil prices are now likely to touch US$60 per barrel – a level they haven’t seen since the spring of last year – before they meet serious resistance.
A new bull market in oil, of course, will fuel a bull market in the shares of companies producing and selling the stuff. Don’t get too excited, though: This part of oil’s boom-and-bust cycle is likely to be modest, compared to the last one. Here’s why.
The background
Since oil became a serious business in the 19th century, petroleum busts have always followed petroleum booms, and vice versa. Indeed, in tough times people in the oil patch always trot out the old joke that “to make a small fortune in the oil industry, you have to begin with a large fortune.” A spectacular period of wealth creation, followed by wealth destruction, took place in 2007-8. You can see it on the left side of the chart below. It’s pretty obvious, but I nonetheless marked the period with a blue arrow. The red arrow on the right of the chartpoints to the current situation. I’ll conclude by zeroing in on that pattern.

Many factors led to this period of stock market turmoil. It began with the US subprime mortgage crisis, which produced a global collapse in interest rates. Investors sought higher yields than those offered by US Treasury bonds, briefly putting their money into oil, the price of which was going through the roof. By 2009, oil prices themselves had collapsed in response to a world-wide deterioration in economic activity. Then they rapidly began to rise.
In a presentation to the 2014 World Petroleum Congress, BP economist Christof Rühl explained that world oil prices had, in constant dollars, been extremely high for a number of years because of supply disruptions throughout the developing world ‘though especially in North Africa and the Middle East.
“Cumulative supply disruptions since the advent of the ‘Arab Spring’ from these countries have reached an extraordinary 3 million barrels per day,” he said. “We are now in a better position to return to the question of why oil prices were so stable,” despite “violent shifts” in production.


Leave A Comment