Central bankers are confronted by a nexus in which unemployment falls, wages stagnant and inflation slows down. It is not supposed to be this way. According to the Phillips curve ( developed in 1958) [1], as unemployment falls, the labor market tightens, wages rise and ultimately inflation picks up. This is a neat way to capture the essence of the business cycle and a major tool used by central banks to set monetary policy.
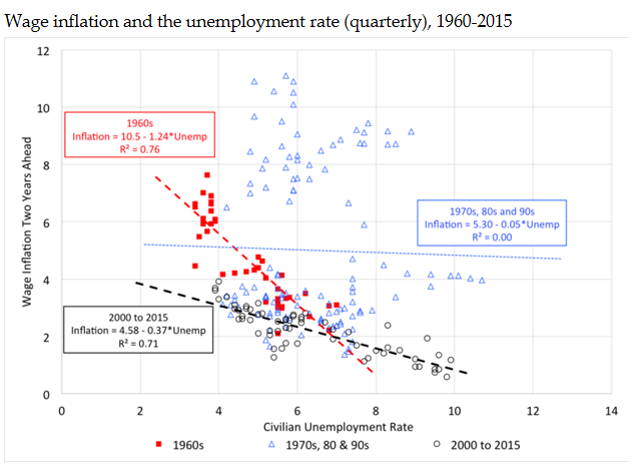
As the accompanying chart shows, the Phillips curve was very much in effect in the 1960s (red dots) revealing a distinct trade-off between falling employment and rising wages. The story was quite different in the 1970s, 1980’s and 1990s (blue dots). During these years, the scatter diagram reveals that trade-off did not exist. No wonder Fed Chairmen Volker and Greenspan did not look to the Phillips curve to guide monetary policy. In the most recent period, 2000-2015 (black dots), there was some evidence of a wage/unemployment trade-off, however, it was nowhere near the strength exhibited in the 1960s. More to the point, since the crisis of 2008, the unemployment rate has fallen significantly, yet wages have barely moved, certainly not in line with the expectations flowing from the Phillips Curve.

Source
At the time of the Fed’s most recent policy decision on June 14, the unemployment rate was 4.4%, a rate that many consider being full employment. That should correlate with progressively rising inflation.Instead, hourly earnings decreased from 2.9% to 2.4%. Wage growth continues to disappoint. Yet, many economists claim that is it just a matter of time before wage inflation rears its head, so the Fed is on the right track in raising rates.
At the same time, the CPI had a year-over-year increase of 1.3%, well below the 2% target. One can only interpret this to mean that the Curve is once again moribund. The Fed successfully pursued the employment mandate but failed to achieve its inflation mandate. Is the dual mandate not really workable? It seems so.


Leave A Comment