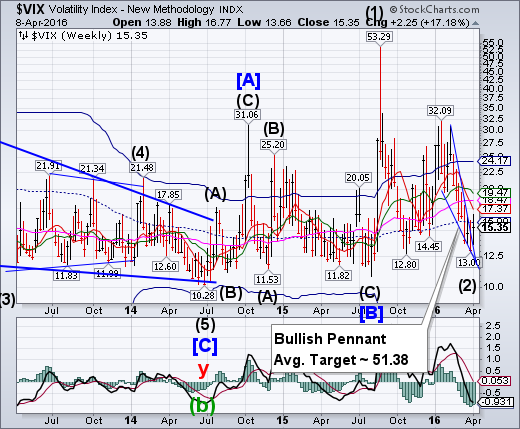
VIX appears to have completed its Wave (2) low and emerged above tis Pennant formation. It also challenged mid-Cycle resistance at 15.90, giving an aggressive buy signal (NYSE sell signal). Two different opinions are expressed below.
(Bloomberg) Betting that the stock market will get more volatile has been one of the worst trades amid a 13 percent rebound in U.S. stocks. It was also one of the most popular, with a record $2 billion added in the last six weeks to exchange-traded products that benefit from a rise in the Chicago Board Options Exchange Volatility Index, the gauge known as the VIX.
(ZeroHedge) Volatility (VIX) is now at its lowest level since before the August sell-off last summer yet CS Fear Barometer remains elevated leaving the spread between the two options-market-based indicators is at its widest ever.
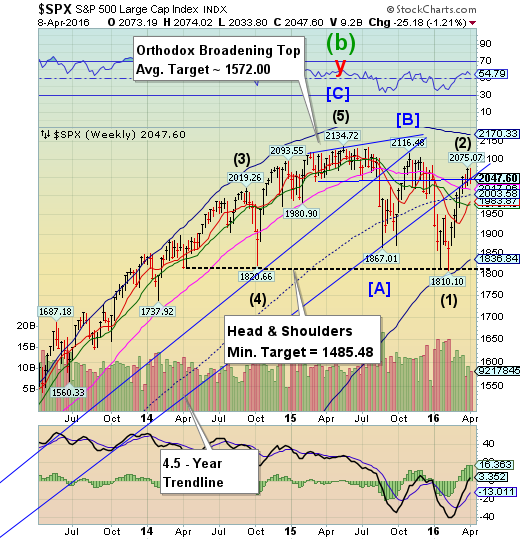
SPX closes beneath the 4.5-year trendline.
The SPX rallied above the 4.5-year trendline at 2055.00, making its high on April 1. This week it has closed beneath it. Trendlines are important support areas that often attract, then repel the markets. Earnings season kicks into high gear next week. SPX average earnings are expected to decline another 7.4% year-over-year in the first quarter after a 7% decline in the fourth quarter.
(Bloomberg) It’s official — the rally in U.S. stocks that erased the worst-ever start to a year has fizzled, with the biggest weekly slide since February depriving the bull market of momentum ahead of what’s forecast to be the steepest earnings slump since the financial crisis.
The Standard & Poor’s 500 Index fell 1.2 percent in the five days to 2,047.60, the second slide in the three weeks since the gauge erased an 11 percent loss for the year. The period was tumultuous, with the average daily swing of 0.8 percent the most in a month, while three days of 1 percent moves ended a 15-day stretch of calm, the longest since March 2015. The Chicago Board Options Exchange Volatility Index capped its biggest weekly advance since January.
Also read, ZeroHedge’s “How Much Of S&P Earnings Growth Comes From Buybacks”
NDX may have reversed course.
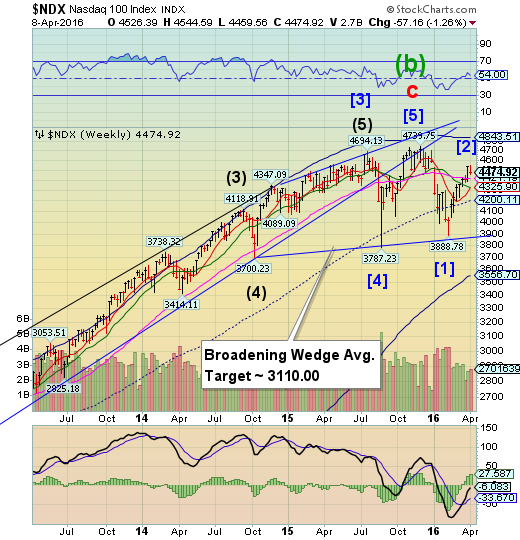
NDX Made its high on Monday, but quickly reversed course. Long-term support is at 4421.19. Should it decline beneath that level, NDX may be on a sell signal.
(CNBC) U.S. stocks closed well off session highs Friday, despite a rally in oil, as the yen strengthened against the U.S. dollar.
The major averages declined more than 1 percent for the week, the worst since Feb. 5 for S&P 500 and Nasdaq composite and the worst since Feb. 12 for the Dow Jones industrial average.
The S&P 500 clung to year-to-date gains in the close after briefly erasing them as the major averages temporarily turned lower in afternoon trade. The Dow Jones industrial average closed 35 points higher after earlier adding 152 points.
High Yield Bond Index makes a new high.
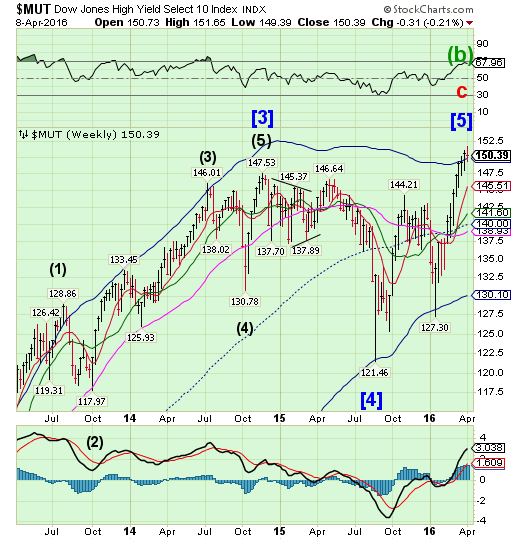
The High Yield Index may have made its final high on Wednesday. This may mark the end of an era for high yield bonds. But we won’t get any cautionary notes from the media and their analysts. See below.
(YahooFinance) Investor flows into high yield bond funds
Investor flows into high yield bond funds were negative last week after six consecutive weeks of inflows. According to Lipper, net outflows from high yield bond funds totaled $545 million in the week ended March 30, 2016, the second-lowest outflows year-to-date (or YTD).
In the previous week, high yield bond funds saw net inflows of $2.2 billion. Even with outflows last week, high yield bond funds witnessed YTD inflows of $7.7 billion.
The Euro rally is running out of time
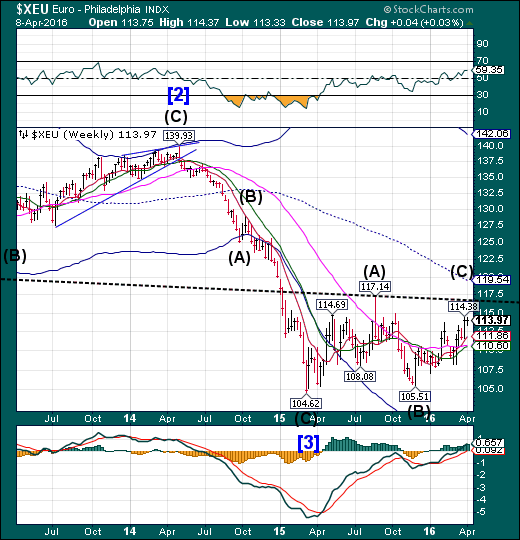
The Euro rally appears to be running out of time without reaching its upside objective. The Cycles Model suggests the Euro may put in an important low in the next two weeks. An untoward event may push the decline deeper than one would expect..


Leave A Comment