
Imaginary Numbers
Yesterday we came across a Reuters report on the rather pedestrian, to put it mildly, third quarter GDP report. Reported “real” GDP was greatly helped by the GDP deflator once again declining sharply, coming in a full percentage point lower than in the second quarter (1.2% instead of 2.2%). Perceptive readers have probably noticed this pattern already: weak GDP numbers always tend to coincide with outsized declines in the deflator.

A basic problem in this context is that “price inflation” in terms of a general price level cannot possible be measured; or let us rather say, such a measurement simply makes no sense, neither mathematically nor logically.
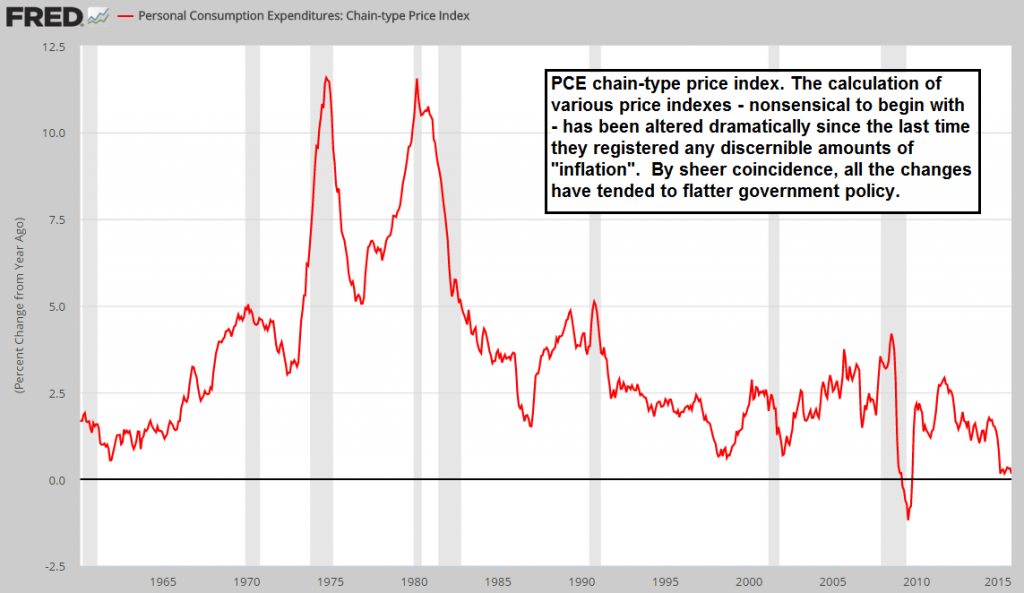
PCE chain-type price index (2009=100), annual rate of change
The main problem is that there is no fixed yardstick which can be used for measurement, as the value of money depends on supply and demand just as other goods do. In other words, one continually changing magnitude is measured with the help of another continually changing magnitude. This is basically nonsense. Moreover, there is an array of heterogeneous goods and services with an array of prices. Adding up cars, potatoes, movie tickets, rents, and so forth, making an “average” out of the result and calling it the “general level of prices” is absurd.
Just as various new calculation methods that have been adopted over the years have resulted in CPI and similar indicators (PCE is used for deflating GDP) becoming ever lower on average, the same methods have resulted in ever higher real GDP numbers. Needless to say, both effects have the side effect of tending to flatter the government’s economic policies and the Fed’s monetary interventions. Surely that is just a coincidence (cough cough).
The effects on GDP are such that it is fair to say that we are dealing with a complete fantasy number. Whatever it reflects, it is not reality and its connection with “economic growth” seems almost coincidental. This is beside the fact that GDP fails to account for the vast bulk of the economy’s production structure, as we have often discussed in these pages. If one wants to know about the actual distribution of economic activity, one needs to consult gross output data.
One effect of this is that many people erroneously assume that consumption is the biggest part of economic activity. It should be clear purely from a common sense perspective that this cannot be true: if we were to continually consume more than we produce, we would soon be living from hand to mouth.
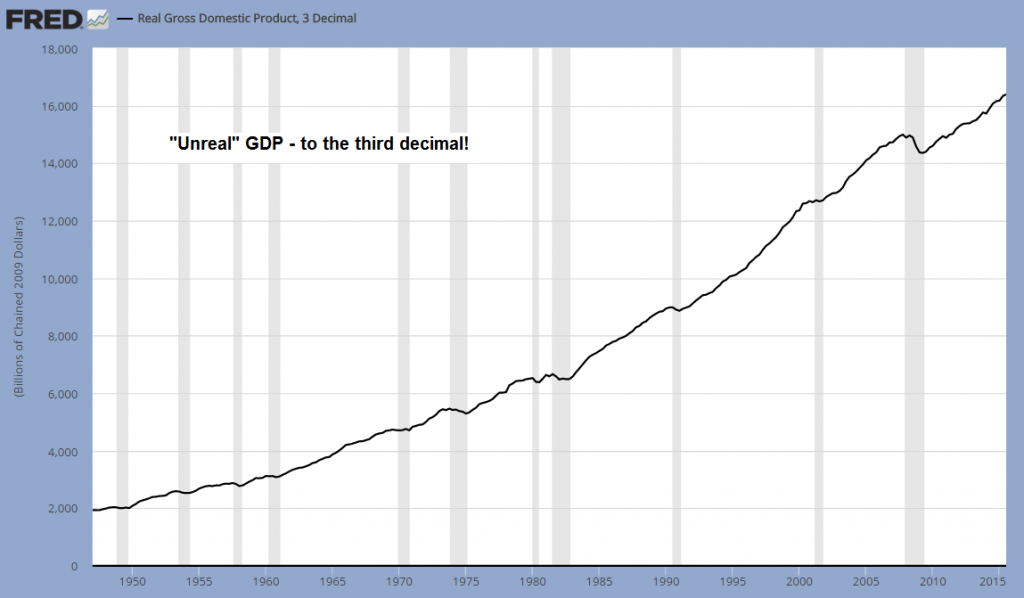
“Unreal” GDP, calculated with great precision by the government’s statistics minions.
We have provided an extensive discussion of the pure fantasy numbers that make up GDP on occasion of the last revision of the calculation (even more fantasy numbers were included, which once again ended up flattering…oh well, you know the drill). We strongly recommend that readers take the time to check said article out in its entirety: “The Mirage of Economic Growth”. Here was just want to quote a few passages discussing especially glaring examples of GDP components that essentially consist of completely imaginary numbers:
“There are for one thing so-called ‘imputations’. These represent the ‘imputed value’ of services consumers get for free even though they apparently shouldn’t. For instance, if checking services are offered for free by banks to customers opening a current account with them, then the government adds the supposed value of these free services to GDP. Note here that no money has actually changed hands, but what is added to GDP are in fact money terms.
Another area in which imaginary numbers play an ever bigger role is the ‘hedonic indexing’ applied to all sorts of goods, something that has an especially large effect on all things to do with information technology. Here is an example from the second quarter of 2003 illustrating the effect (we have chosen this time period randomly, mainly because we happen to have the exact data at our fingertips. It should be pointed out though that the error in this data series compounds over time). In Q2 of 2003, actual spending on computers increased by $6.3 billion, from $76.3 billion to $82.6 billion.
If simply ‘every monetary transaction’ were added to GDP, then this is the number that would have been added, and thereafter it would have been massaged by the ‘deflator’. If not for hedonic indexing, that is. Before we tell you, try to guess how big an increase in spending on computers the government actually added to GDP in this instance. Was it 20% larger? 30%? Maybe even 50%? Hold on to your hat.
The number added by government to GDP instead of the $6.3 billion in actual additional spending was $38.2 billion. In other words, almost $32 billion in completely imaginary money that no-one ever spent or received, with the total number used by the government amounting to more than 6 times the actual spending growth was used for the calculation of ‘real GDP’. It should probably be renamed ‘unreal GDP’.


Leave A Comment