
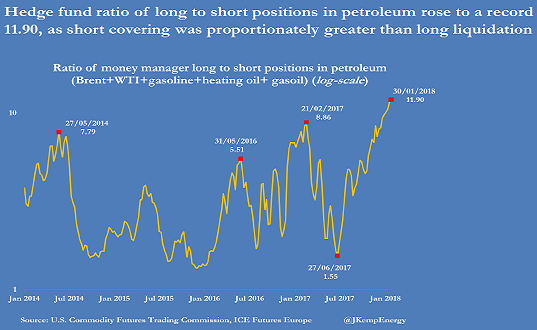
Oil and commodity markets long ago lost contact with the real world of supply and demand. Instead, they have been dominated by financial speculation, fuelled by the vast amounts of liquidity pumped out by the central banks. The chart above from John Kemp at Reuters gives the speculative positioning in the oil complex as published last Monday:
The size of the rally has also been extraordinary, as I noted 2 weeks ago. At its peak, the funds owned 1.5bn barrels of oil and products – equivalent to an astonishing 16 days of global oil demand. They had bought 1.2bn barrels since June, creating the illusion of very strong demand. But, of course, hedge funds don’t actually use oil, they only trade it.
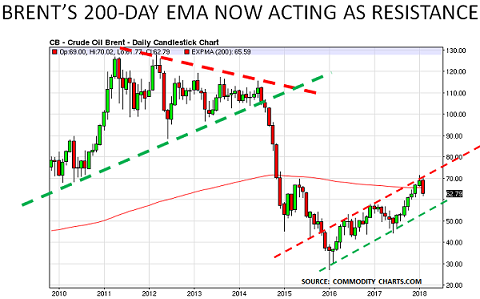
The funds also don’t normally hang around when the selling starts. And so last week, as the second chart shows, they began to sell their positions and take profits. The rally peaked at $71/bbl at the end of January and then topped out on 2 February at $70/bbl. By last Friday, only a week later, Brent was at $63/bbl, having fallen 11% in just one week.
Of course, nothing had changed in the outlook for supply/demand, or for the global economy, during the week. And this simple fact confirms how the speculative cash has come to dominate real-world markets. The selling was due to nervous traders, who could see prices were challenging a critical “technical” point on the chart:


Leave A Comment