
 Photo by American Public Power Association on Unsplash
Natural Gas Elliottwave Analysis
Mode – Impulsive
Structure – Impulse Wave
Position – Wave (iii) of 5
Direction – Wave (iii) of 5 still in play
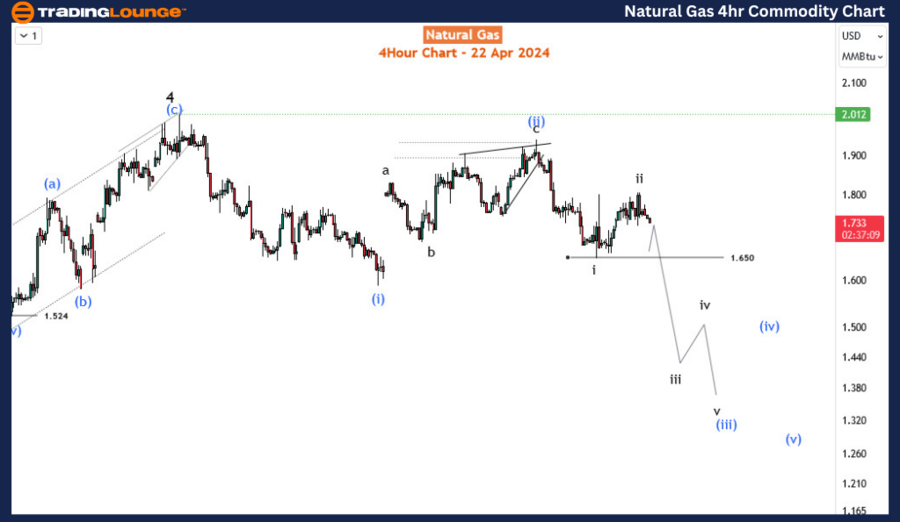
Details: Wave (ii) taking a higher leg. Still favors the downside for (iii) on the way to complete wave 5 of (3). Not much has changed since the last update. If current rallies go higher, wave 4 can be considered a triangle as the daily chart shows.In the past two months, Natural Gas has exhibited a sideways movement, consolidating after the resumption of the bearish trend that commenced in October 2023. This consolidation phase presents a crucial juncture for traders, as a break below the lower boundary of this range could signal a continuation of the downward trajectory. In today’s Elliott wave analysis of the commodity, we aim to identify potential entry points for sellers and delineate the forthcoming bearish targets.Examining the daily timeframe since August 2022, Natural Gas has been entrenched in a bearish trend, completing either a full bearish impulse or possibly culminating in an A-B-C corrective pattern, with wave C initiating from November 2023 and evolving into an impulse. However, considering the corrective nature of the preceding rally from July 2020 to August 2022, it’s prudent to interpret the decline from August 2022 as an impulse. Consequently, we find ourselves within the confines of the 5th wave, denoted as blue wave 5 (circled), which commenced in November 2023. This 5th wave is unfolding as an impulse, delineated as waves (1) to (5). Presently, the price action corresponds to wave (3), specifically within wave 4 of (3). Since the conclusion of wave 3, the price movement has been characterized by sideways consolidation, potentially forming either a triangle pattern or a 1-2-1-2 corrective structure.Upon scrutinizing the 4-hour chart, indications lean towards a 1-2-1-2 corrective pattern. However, if the ongoing short-term rebound surpasses certain thresholds, we may need to reconsider and favor a triangle formation instead. Wave 4 terminated around the significant psychological level of 2.00, suggesting a (i)-(ii)-i-ii structure, with expectations for a breakdown below 1.65 to confirm the onset of wave iii of (iii) as wave 5 progresses. Regardless of whether it unfolds as a 1-2-1-2 correction or a triangle pattern, our anticipation remains for the price to remain below the high of 2.012, validating our bearish outlook. Traders should closely monitor price action for confirmation of these expected movements and adjust their strategies accordingly.Technical Analyst : Sanmi Adeagbo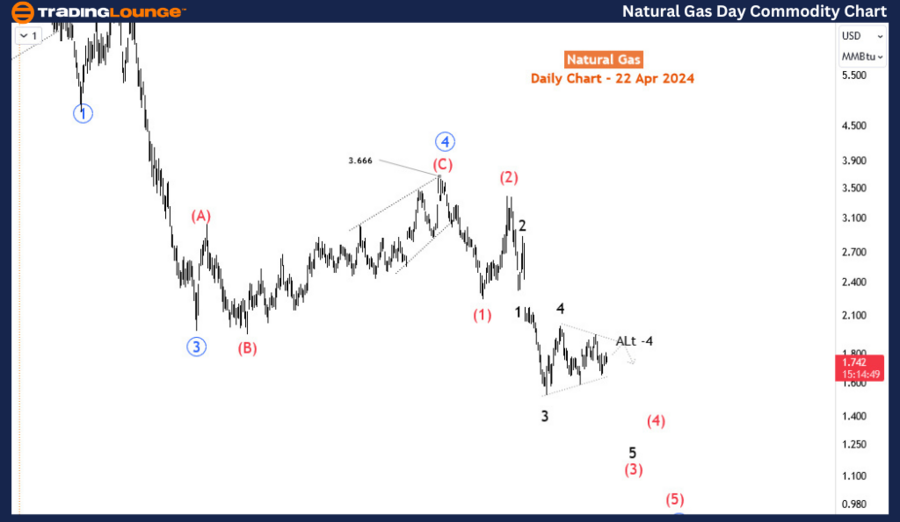
 More By This Author:Elliott Wave Technical Analysis: Visa Inc. – Monday, April 22
Elliott Wave Technical Forecast: Unlocking ASX Trading Success: Transurban Group
Elliott Wave Technical Analysis: U.S. Dollar/Canadian Dollar


Leave A Comment