
While most members are focused on the precious metals, I’ve been waiting patiently for two other sectors to setup a long term buy signal which I believe happened last week. I know you are well aware of my mantra that big consolidation patterns lead to big impulse moves. What’s pretty amazing is these two sectors have an almost identical long term consolidation pattern and are breaking out at the same time. It stands to reason that if Emerging Markets are going to be strong then the Basic Materials sector should benefit as well.
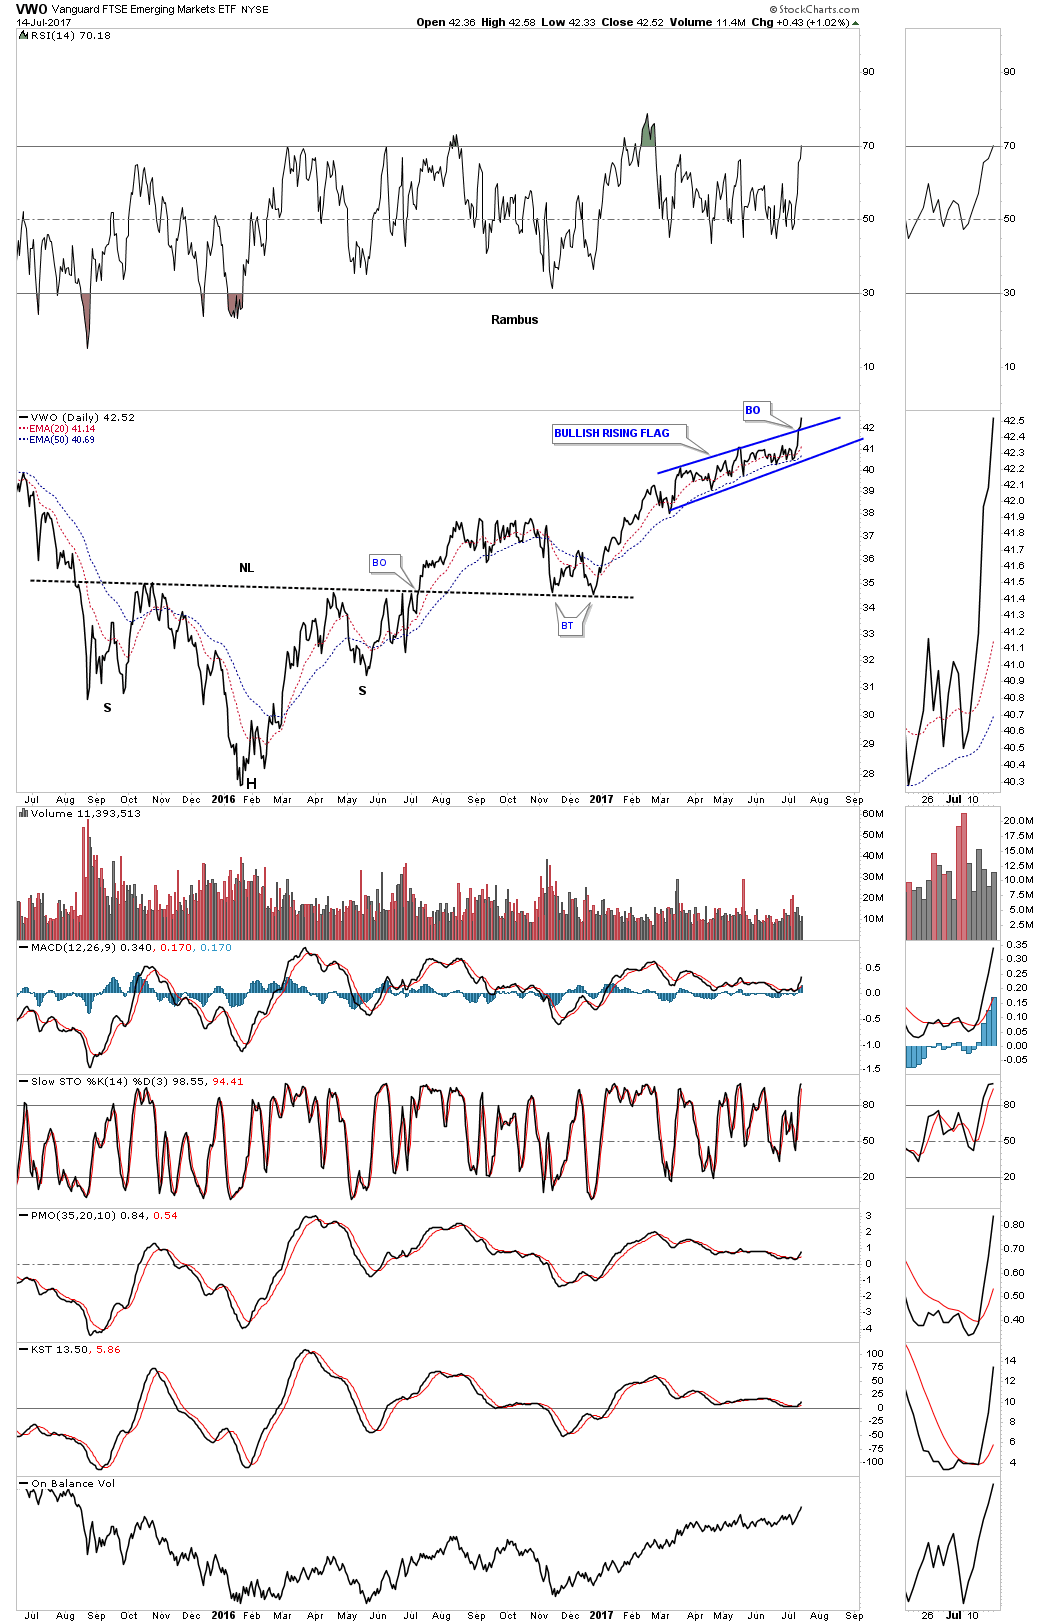
Most like to look at the EEM, emerging market index, but there is another emerging market index which trades with much more volume, VWO which I will use in this post. Lets start with just a simple daily line chart for VWO which shows a H&S bottom in place and a breakout yesterday of the blue bullish rising flag. Keep those two patterns in the back of your mind when we look at the longer term charts.
Below is a 5 year weekly bar chart which shows a double H&S bottom with the breakout of the blue bullish rising flag yesterday, which has formed just below the important overhead resistance zone. There are 2 things the blue bullish rising flag is suggesting, first, these types of patterns form in strong moves and second, it is forming just below important overhead resistance. We’ve studied this setup many times in the past, which states when you have a small consolidation pattern form just below important overhead resistance, it usually leads to a breakout. The small consolidation pattern builds up the energy needed for the final breakout move.
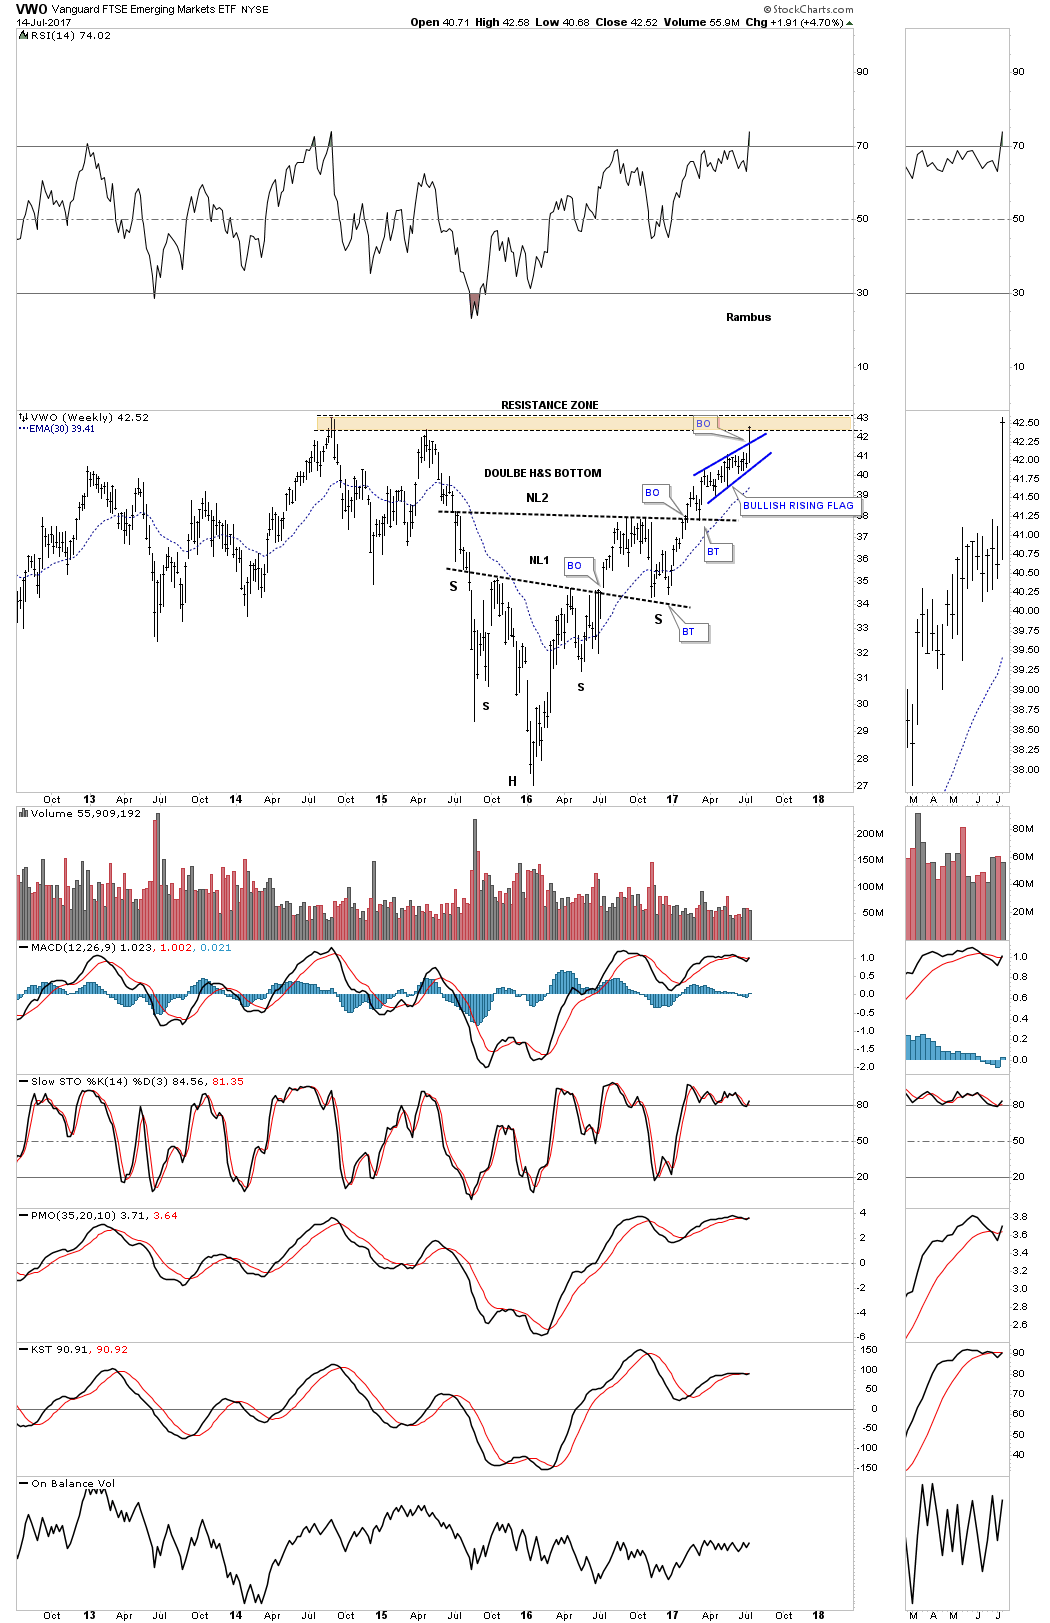
Now I would like to show you the long term weekly chart for the VWO so you can see the 6 year rectangle consolidation pattern that has been building out. Note how the blue bullish rising flag has formed just below that 6 year top rail of the rectangle consolidation pattern. If there was ever a place to see one of these types of bullish patterns buildout this is it.


Leave A Comment