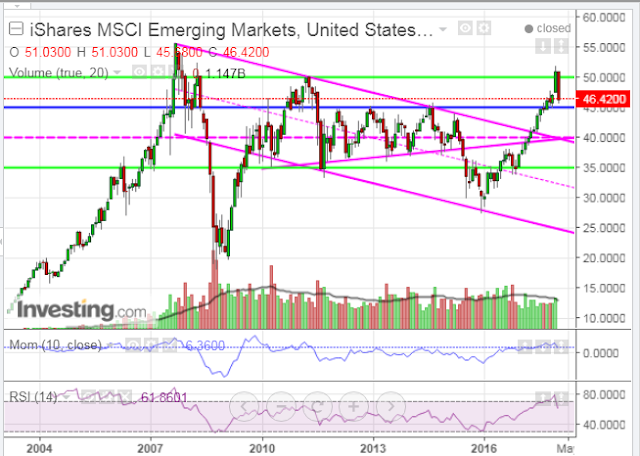
The following monthly chart of the Emerging Markets ETF (EEM) shows that price has dropped below major resistance around the 50.00 level, after rallying towards its all-time high of 55.82. Near-term support is at 45.00, while major support lies below at 40.00 (the apex of a converging trendline and channel), or lower at 35.00 (historical price support).
Whether or not its current price represents fair value on this longer timeframe remains to be seen. The fact that January’s gap up has now been filled may be a warning that lower prices are ahead, before this ETF begins to stabilize and present more of a viable buying opportunity.


Leave A Comment