
US INFLATION DATA THIS WEEK – FOMC NEXT WEEK
The next couple of weeks are lining up to be quite interesting for the US Dollar, particularly after last week’s robust NFP print. Non-Farm Payrolls blew through the expectation of +205k to print at +313k, but lagging Average Hourly Earnings was a bit of a hindrance and the net price action result was a spinning top formation for Friday in DXY. A spinning top is similar to a Doji in the fact that they’re both ‘indecision’ indicators, but the spinning top has a slightly wider body than what might show up in a Doji.
US DOLLAR PRICE CHART VIA ‘DXY’: DAILY TIME-FRAME, FRIDAY NFP PRODUCES SPINNING TOP, 90.00 SUPPORT
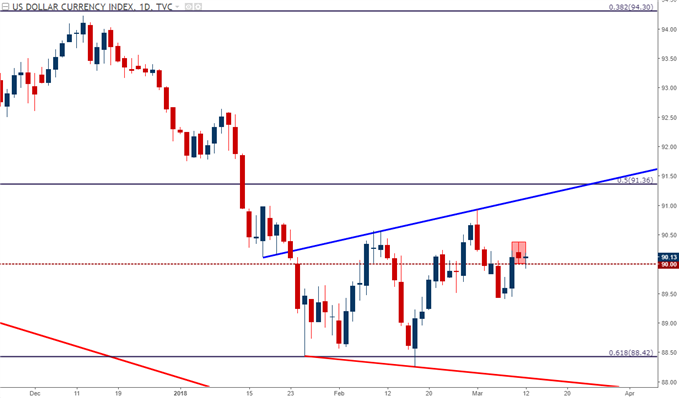
Chart prepared by James Stanley
The price action that we saw last week around NFP helps to show how important inflation data is in the current context. Even a blowout on the headline number couldn’t elicit any significant strength in the Greenback, and the likely reason why is the buffer of that lagging AHE. Speaking to this theme, February saw a slight beat on the headline, +200k v/s an expectation of +180k, but the US Dollar struck a spate of strength that lasted for about a week; largely on the basis of a surprisingly strong Average Hourly Earnings print in that report. That number originally came-in at 2.9% but was revised down to 2.8% on Friday. February Average Hourly Earnings disappointed by coming-in at 2.6% versus the expectation of 2.8%.
This is key because on next week’s calendar is the Federal Reserve at rate decisions that’s widely-expected to bring a hike. Probabilities are currently at 88.8% for a rate hike next Wednesday via CME Fedwatch. Before we get to that rate decision, we have US CPI data on the docket for tomorrow; and this should make for an interesting backdrop for USD price action as we get closer to that next rate adjustment out of the FOMC.
US DOLLAR PRICE CHART VIA ‘DXY’: FOUR-HOUR TIME-FRAME, EXPANDING RANGE AS FOMC NEARS


Leave A Comment