
EUR/USD Daily Chart
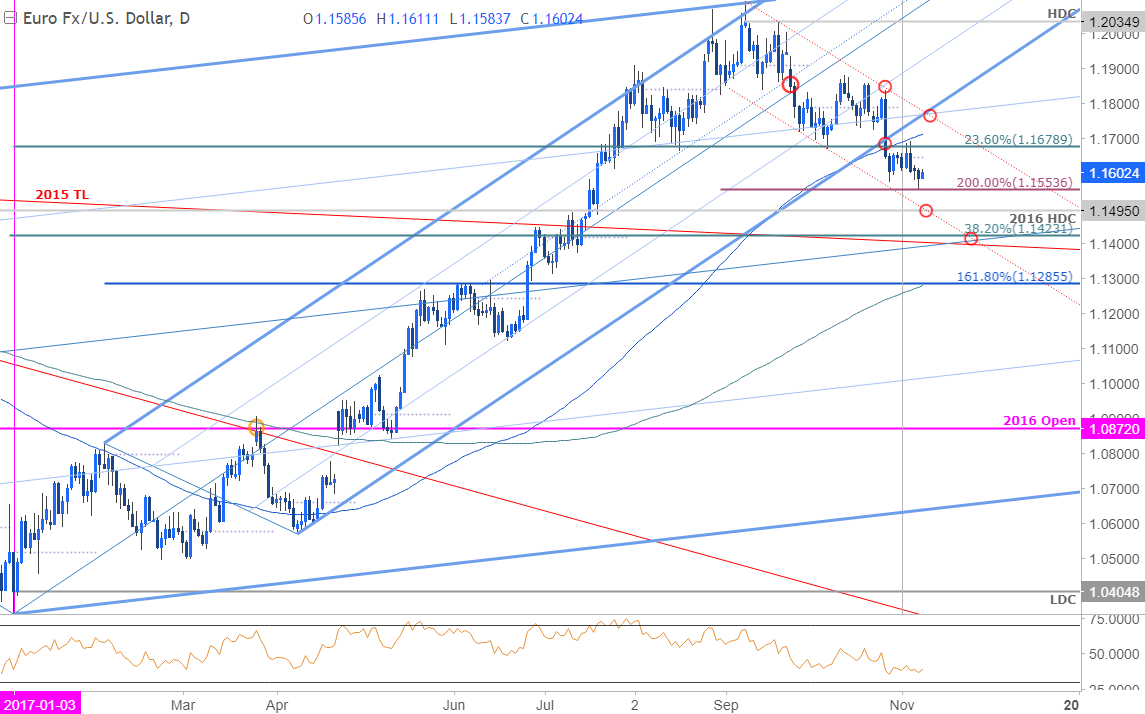
Technical Outlook: EURUSD broke below a critical support confluence last month at 1.1679– ‘a region defined by the lower median-line parallel, the 23.6% retracement of the 2017 range and the 100-day moving average.’ The subsequent decline has taken out our initial support targets with price rebounding yesterday of the head & shoulders measured move at 1.1554.
Daily momentum divergence suggests the immediate short-bias may be at risk here but the broader focus remains weighted to the downside while below confluence median-line resistance ~1.1780s. A break lower from here targets the 2016 high-day close at 1.1495 backed by a critical support confluence at 1.1400/23.
EUR/USD 240min Chart
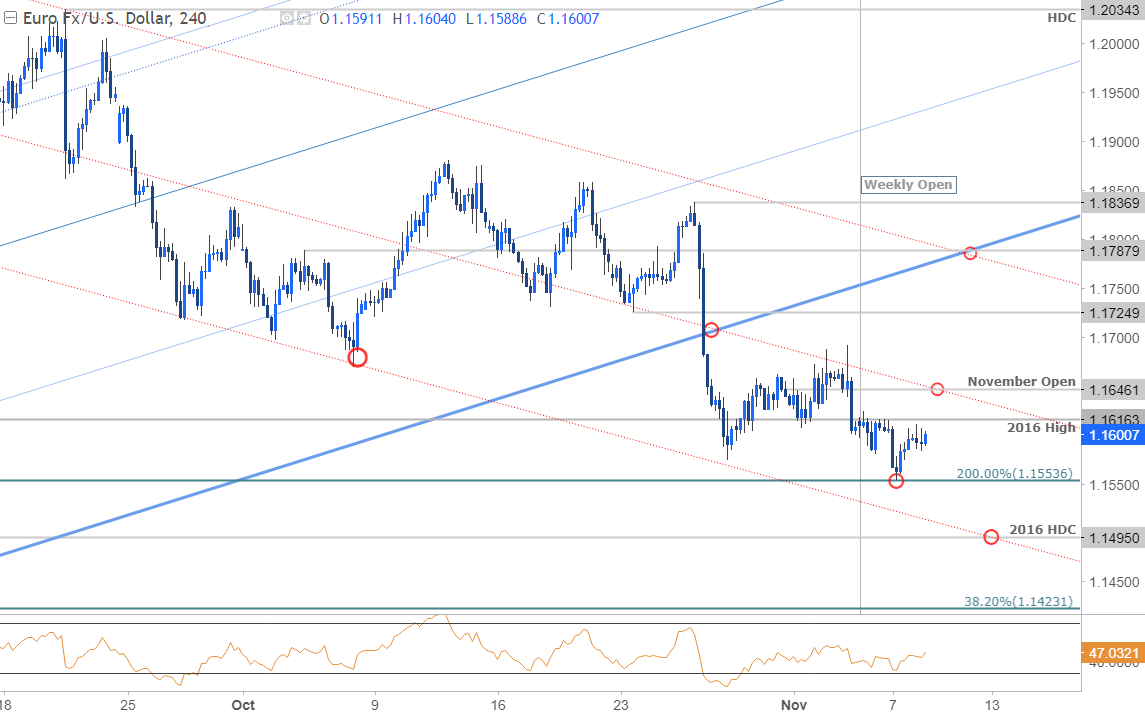
Notes: A closer look at near-term price action highlights a precise rebound off the 1.1554 target yesterday with initial resistance eyed at 1.1616 backed by our near-term bearish invalidation level at monthly open at 1.1646. A breach / close above this threshold would suggest a larger recovery is underway with such as scenario targeting objectives at 1.1725 and critical resistance at 1.1788.Bottom line: the immediate risk is for some near-term recovery but ultimately, I’d be looking to fade strength while below the median-line.


Leave A Comment